

What About Warmup?
/When benchmarking your application, warmup iterations are a really good idea. Specifically: if you're running something a lot of times to figure out how fast it goes, start by running a bunch of "throwaway" iterations first.
Let's look at Rails Ruby Bench and see how warmup iterations change MRI's benchmark performance.
Just want graphs? Scroll down, you'll see them. Want the long-winded explanation of what warmup is and why we care? Keep reading.
But First, Why?
Warmup time makes sure all your code is compiled, and that Ruby has set up its method caches. It makes sure that code that will define methods on demand (like ActiveRecord) has already done so. If you're dealing with another caching system like databases, Rails fragment caching or your file system, warmup iterations make sure that those caches are full and ready.
Warmup time also lets Ruby's memory system scale up. MRI Ruby starts with a fairly small amount of memory and increases as it needs to, often during garbage collection. A bit like TCP/IP slow-start, Ruby's memory system intentionally starts out slow/small and consumes more resources as it sees more requests for memory. Depending on your app, you may also have a literal TCP/IP slow-start to wait through as well. The garbage collector will get faster over time in Ruby 2.3 for most programs because it's generational. When older permanent data is marked as "old generation," it won't be examined on most checks for garbage. That speeds up garbage collection as data that never goes away is rarely examined. (What data is "permanent"? Think of compiled classes or cache data structures. They may change, but they're not going to lose their references and be garbage collected. Until the program ends, they're not going away.)
The warmup gets your app into a "steady state", as the technically-minded folks would have it. Your app has allocated all appropriate resources, reclaimed early memory garbage, loaded up its caches and perhaps defined or monkeypatched methods where needed. All the early problems are worked out. The app should be running at full speed from the first post-warmup request.
Ruby implementations like Rubinius, OMR + Ruby, JRuby and TruffleRuby all need warmup iterations even more - they use JIT to compile frequently-used methods to a faster form. That always takes at least a few seconds. It can easily take several minutes to finish up. JIT is a lot of the reason JVM programs are infamous for long start-up time. It's why you generally use JVM languages for long-running servers, but rarely for command-line programs where a tenth of a second can be most of the runtime.
Timing
We looked at Ruby 2.3 with Discourse 1.5.0 recently. There's likely to be noticeable warmup in Ruby 2.3 since the new garbage collector is generational. A generational collector will get more efficient once its memory usage pattern is "burned in" and permanent data has been marked as being part of the old generation.
So let's look at varying amounts of warmup, between 0 and 1000 requests. As I began, I expected to see most of the difference between 0 and 10 requests of warmup, and maybe a bit up to 100 requests. With a JITting implementation like JRuby I'd expect to see a significant difference between 100 and 1000 warmup requests, but MRI doesn't do that.
Warmup behavior may also be a little funny because the warmup requests, like the later benchmark requests, get divided between receiving Puma workers and between requesting load-test threads. In other words, one warmup request doesn't mean one per Puma worker or one per load-test thread. It means exactly one, which may warm up only one of the Puma workers. Ten requests will hit most or all of the ten Puma cluster processes, and 100 requests will definitely hit all 10 Puma processes and all 30 load-test threads. Does it matter if every thread is warmed up? Not that I currently know of. The method cache should warm up extremely quickly, the first time each piece of code gets executed.
For all of these trials, I'm doing something along the lines of "for i in {1..11}; do ./start.rb -s 0 -w 0; done". The "-w" argument gives the number of warmup iterations. Every successful run-through give 1500 requests, so doing 11 of them gives around 15,000-16,500 requests for that combination of Ruby version and number of warmup iterations, depending on whether all 11 run-throughs succeed (for this post no runs failed, so it's 11 full runs for each.) As usual, I'm using process.rb in the Git repository for basic statistical processing.

Please look at the vertical axis labels - this difference is significant, but not nearly as big as it looks.
Conclusions
Looking at the request graph (the first one,) the big takeaway is: warmup is a noticeable thing, especially for slower requests like the 90th percentile - but it makes a small difference even for the median request. And even at 1000 warmup iterations, the effect continues. 100 warmup iterations is closer to 10 iterations' speed than to 1000. I wouldn't expect a big speedup at 100,000 warmup iterations, but it might still be continuing. And that's without JIT.
So: definitely include warmups in your benchmark.
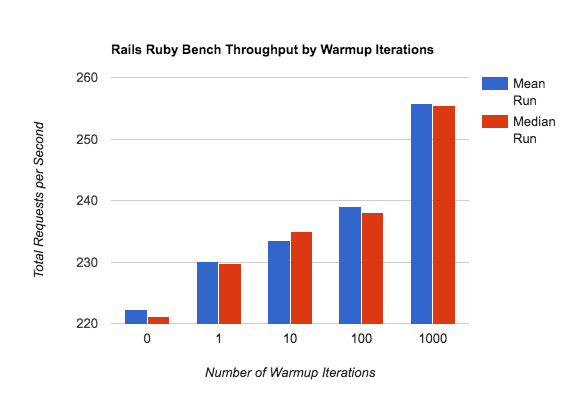
Looking at the throughput graph (the second one,) we see about a 10% difference in throughput between no warmup and 1000 iterations of warmup (no really - check the vertical axis labels.) That's significant, but it's not crazy-huge. Warmup is a thing, even for MRI, but it still does a good job of keeping startup time low. Even starting completely flat-footed, it runs at about 90% of maximum throughput. That's not bad. We could make warmup look even more dramatic with fewer total requests, of course, but 1500 requests (about 6 seconds of total runtime with 10 Rails multithreaded processes) is short enough that warmup is already pretty dramatic.
Also, when looking at JIT-enabled implementations like JRuby, understand that some of the warmup isn't JIT. Other caches, the memory system, a generational garbage collector -- all of these things create a measurable speed difference between how your server runs after 100 requests and how it runs after 1000 or 10,000 requests.
What Didn't We Measure? What Needs Fixing?
By just restarting repeatedly, we didn't measure changes to the local file system cache -- files that got checked often were still in cache. Other OS changes that persist beyond the process boundary were probably not reset either. So: there's definitely more effect than we measured here. I can think of a few ways to check, but mostly by running large processes in between (reset the caches) or starting a new AMI every time (very slow.)
I'm sure there's a way in Linux to reset all sorts of fun process settings and re-warm things up. But at that point, we're mostly measuring Linux, not Ruby.
One problem I need to fix with benchmarking is that I'm not using a dedicated EC2 instance. Usually that's not a problem, but occasionally I bring up a t2.2xlarge that just isn't running acceptably -- and then kill it, of course. But realistically, it's time to start using dedicated instances. There's no such things as a dedicated t2.2xlarge - the closest is an m4.2xlarge, which is nearly the same but not quite. So: it'll be time soon to switch instance types.