Comparing Rails Performance by Ruby Version
/The Ruby benchmark I've been working on has matured recently. It builds an AMI that runs the benchmark automatically and makes it downloadable from the AWS instance. It has a much better-considered number of threads and processes for Puma, its application server.
So let's see how it works as a benchmark. Let's see if there's been any particular change in Rails speed between Ruby versions. (Just want to see the pretty graphs? Scroll down.)
Because of Discourse, I'll only check Ruby versions between about 2.0.X and 2.3.X -- Discourse doesn't support 2.4 as of early April 2017. I'm not using current Discourse because the current version wants gems that don't support Ruby 2.0.X. That's a problem with using a real app for a benchmark: it creates a lot of constraints on compatibility! When I move to a version of Discourse that supports Ruby 2.4.0, it'll also be using syntax that prevents using Ruby 2.2.X or earlier. It's good that we're taking benchmarks now, I suppose, so that we can compare the speed to later Discourse versions! But that's another post...
Version Differences, Speed Differences
So we can only compare version 2.0, 2.1, 2.2 and 2.3? Great, let's compare them. I've added some extra logging to the benchmark to record the completion times of each individual HTTP request. That makes it easier to compare my benchmark with Discourse's standard benchmark, the one they run on RubyBench.
Each run of the benchmark completes 1500 requests, divided evenly among 30 load-testing threads. That's only 50 requests/thread, so you'll see some variation in how long the threads take to complete. I checked the variation between all individual requests (across all threads, 1500 samples/run) and the variation among single-thread runs (30 samples/run, 50 requests/sample.)
Individual request times - later Ruby versions are faster by a roughly constant factor.
Each column here averages 50 individual requests. So there's less variation, but lots of slow, steady improvement.
The individual request time varies a lot, as do the 0th and 100th percentiles -- that's expected. The median requests and per-run totals get noticeably faster - easily 30% faster by any reasonable estimate. And the slowest requests (90th+ percentiles) improve by a similar amount.
Here is the numeric processed data for these graphs. It's output from process.rb in the Git repo. I haven't included my JSON files of test data. But if you run tests using the public AMI (current latest: ami-36cb5820) or an AMI you create from the Packer scripts, you should get very similar results. Or email me and I'll happily send you a copy of my JSON results.
Ruby Bench
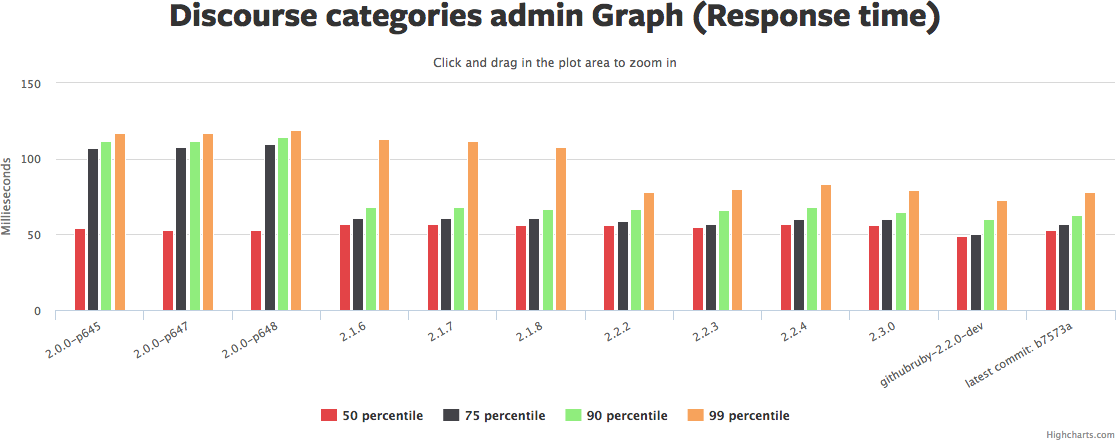
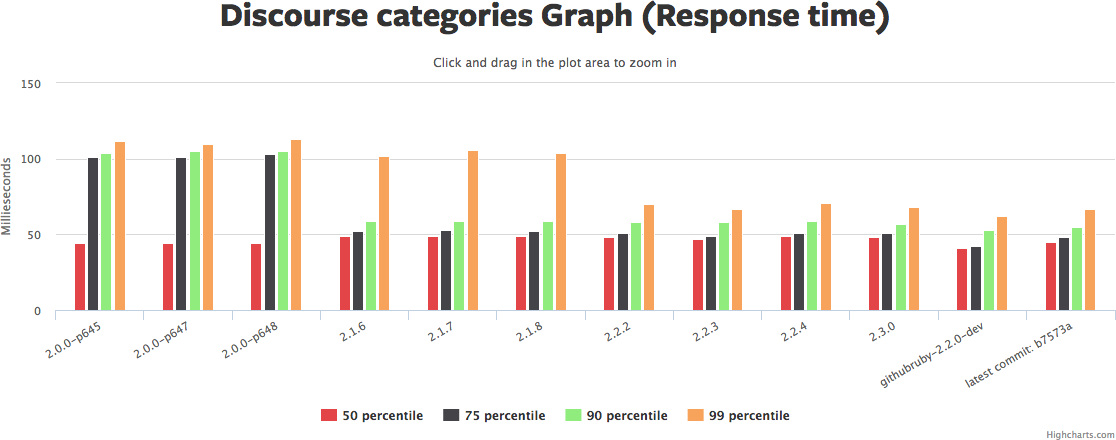
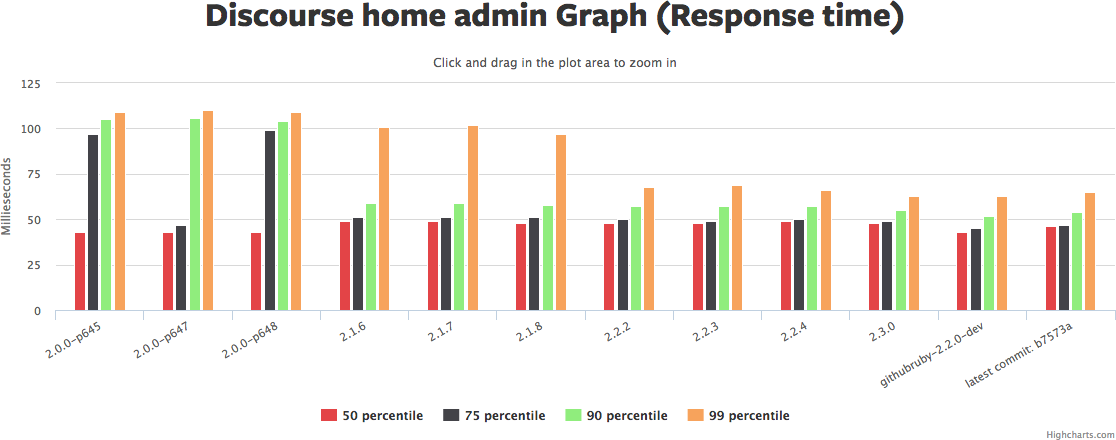
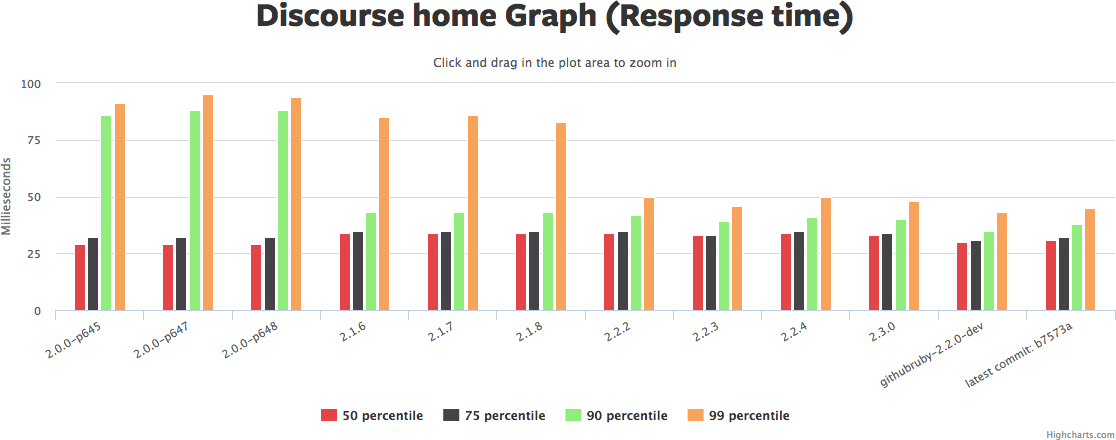
Ruby Bench has numbers for the original Discourse benchmark - but only for older Ruby and Discourse versions. But we can get a second opinion on how much Ruby performance has increased between 2.0 and 2.3. We'll check that the Rails Ruby Bench results are approximately sane by comparing them to a simpler, more established benchmark that's already in use.
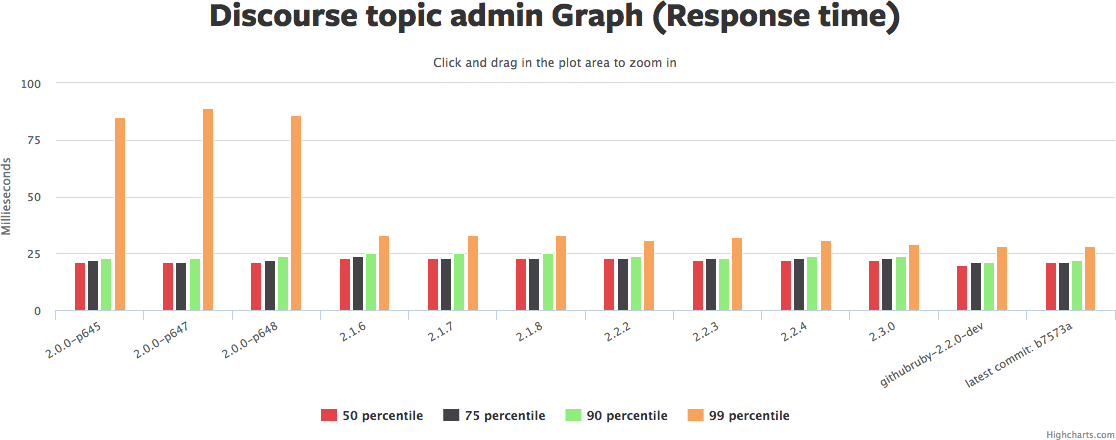
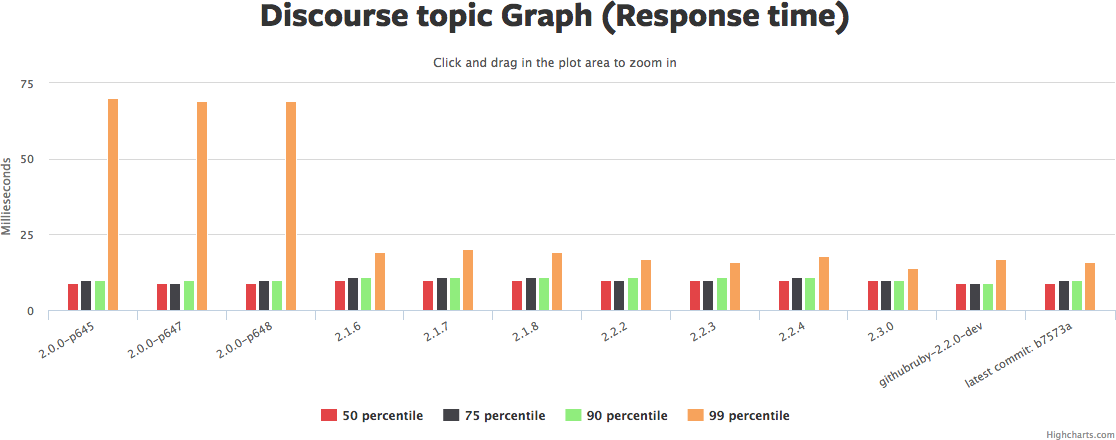
Click the graph to rotate through pictures of several similar graphs from Ruby Bench. See the same Ruby Bench link to get source code and exact benchmark numbers.
There's a lot to those graphs. I'd summarize it as: the median request hasn't really gotten faster, but the 90th/95th/99th have gotten *much* faster, in some cases 2x or more. Yet another reason why "3 times faster" is hard to nail down.
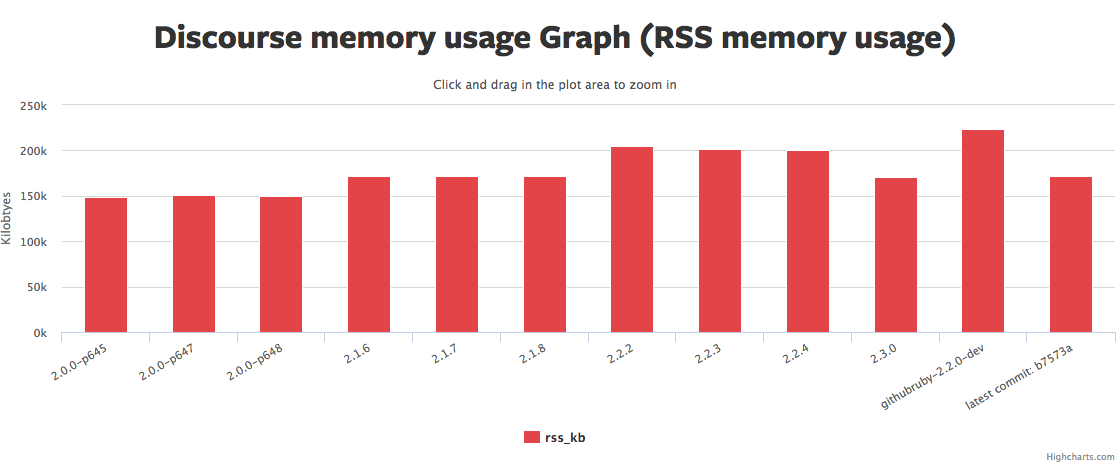
Memory usage (the red graph) has also gotten a bit higher. So we've traded more memory for more even response times. That sounds like a win to me. YMMV.
Why hasn't the median request gotten faster in this benchmark? Hard to say. There may be a few optimizations that are included as backports that show up in the newer benchmark... But if so, not many. It's also possible that concurrent performance is better but straight-line sequential performance isn't. The default Discourse benchmark doesn't set "-c" for concurrency, so it's only checking one request at once.
(Edited to add: Nate Berkopec points out that a lot of this is probably garbage collection. Specifically: Discourse benchmarks hit one URL, and after Ruby 2.1 either have a *huge* 99th-percentile drop or barely any. My benchmarks hit a variety of URLs for every thread, and have a medium amount of 99th-percentile drop. So the post-2.1 drop is likely to be mostly GC. Discourse URLs that generate a lot of garbage dropped a lot in runtime, while URLs that generate very little garbage dropped barely at all. And all Rails Ruby Bench threads hit a mix of those. This is why I go to RailsConf.)
Ruby 3x3
So what does all this say about Ruby 3x3? It says that Ruby 2.3.4 is already running 150% the speed of 2.0.0-p648 for Ruby on Rails. That's a great start. It says that Ruby is fixing up a lot of edge cases - requests that used to cause slowdowns in rare cases are getting even rarer, so the performance is a lot more predictable.
I think it also suggests that my Rails benchmark is a pretty good start on measuring Rails performance in these cases.
Where we may really see some interesting effects for Rails is when Guilds are properly supported, allowing us to increase the number of threads and decrease processes, running more workers in the same amount of memory. This benchmark should really sing when Guilds are working well.
Caveats For Pedants Only - Everybody Else Close the Tab
Currently there are no warmup iterations after the server starts. That's going to significantly affect performance for non-MRI Ruby implementations, and probably has a non-trivial current effect even on MRI. I'll examine warmup iterations in a later post.
Data is written to JSON files after each run. You can see how that data is written in start.rb in the Git repo, and you can see how it's processed to create the Gist and data above in process.rb.
If even one request fails, my whole benchmark fails. So you're seeing only "perfect" runs where all 1500 requests complete without error. You'll see an occasional failed run in the wild. I see bad runs 5%-10% of the time. I don't currently believe this significantly skews the results, but I'm open to counterarguments.
In a later post I'll be increasing the total requests above 1500. Then the variance per run should go down, though the variance per HTTP request will stay about the same. 1500 requests just isn't enough for this EC2 instance size and I'll be correcting that later. Also, it's possible for "lucky" load threads to finish early and not pick up pending requests, so the 100th percentile load threads can have a lot of variation.
Ruby Bench uses Discourse 1.2.5, which is very old. I used 1.5.0 because it's the oldest version I could get working smoothly with recent Ruby and Ubuntu versions. I'll examine how Discourse has changed in speed in a future post. This is a hazard of testing with a real application that changes over time.
Ruby Bench uses very old versions of Ruby for its Discourse benchmark. Basically, Discourse broke for head-of-master Ruby when 2.4.0 merged Fixnum with Integer. So Ruby Bench stopped testing with newer versions. When Discourse works with Ruby 2.4 (note: coming very soon), they can update and I can write a speed-comparison blog post that includes 2.4.
Ruby Bench and my benchmark use different hardware (in my case, an EC2 t2.2xlarge non-dedicated instance.) The slope of the graph comparing one Ruby version with another should be similar, but the request times will be different. So: don't directly compare seconds/request between their graphs and mine, for many good reasons.
The standard Discourse benchmarks request the same URL many times in a row using ApacheBench. Ruby Bench uses the standard Discourse benchmark, so it does the same. My benchmark requests different URLs in different orders with different parameters, which affects the speed of the resulting benchmark. That's what I mean when I say their results should be only "roughly the same" as mine. You can think of my results as "roughly" a weighted blend of multiple of their results, plus some URLs they don't test.
I don't include 1st%/99th% data for full runs because there just aren't enough samples. Until you're looking at 500+ samples for each Ruby version, the 1% and 99% mark are going to bounce around so much that it doesn't make sense to show them. That's about 15 full runs-through of the benchmark for each Ruby version. That's perfectly doable, but more samples than I collected for this post. Instead, I showed the 90th and 10th percentile, which are much more stable for this amount of data. As stated above, you can also request my full JSON data files and get any percentile you feel like from the raw data.
(Have you read this far? Really? I'm impressed! By the way, AppFolio is hiring Ruby folks in Southern California and is an awesome place to work. Just sayin'.)


