Enhancing Machine Learning Workflows with Large Language Models: A Hybrid Approach


Large Language Models (LLMs) like GPT-4 are considered a foundational base of an intelligent system upon which other layers can be built. However, they could also add immense value when integrated with existing Machine Learning (ML) workflows to augment their outcomes. By embedding LLMs within traditional ML pipelines, we can leverage their advanced language understanding and contextual awareness to significantly improve performance, flexibility, and accuracy while ensuring the reliability and baseline performance of the existing pipeline. 

This approach maximizes the strengths of traditional models and LLMs. It opens up new possibilities for AI applications - making existing systems more innovative and responsive to real-world data nuances. The cherry on top is that there is no added effort to completely re-architect the existing ML architecture to integrate the LLM intelligence.

Traditional Machine Learning Workflow

Traditional ML models, particularly binary and multi-class classifiers, form the backbone of numerous ML applications in production today. A binary classifier differentiates between two classes, like distinguishing between spam and non-spam emails. In contrast, a multi-class classifier can identify multiple categories, such as categorizing news articles into sports, politics, or entertainment. These models learn from vast labeled datasets to make their predictions.

Key Concept: Thresholding in Classification

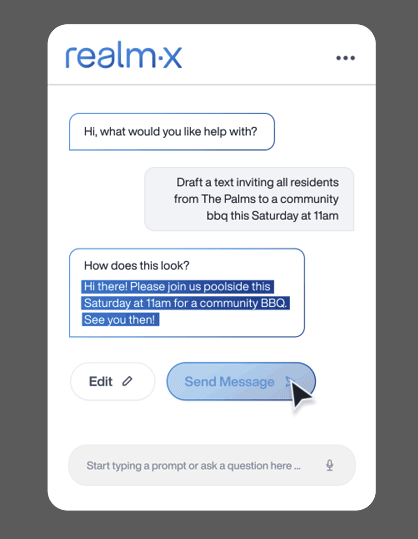
Since these ML models are trained on classification tasks, they output probabilities for the input belonging to each of the possible classes, which collectively add up to 1. For instance, consider a system with an existing AI model designed for property management (PM) that responds to a prospect’s questions about a specific unit based on existing information in the PM system. This AI model provides two outputs. First, it generates an answer to the question posed by the prospect. Second, it delivers a probability score reflecting confidence in its proposed answer. This is a classification score, where the AI model outputs the probabilities of being confident versus non-confident in the answer it has come up with. 

For instance, the model might output a probability of 0.8 corresponding to its confidence, indicating that it is moderately sure of its response. However, perhaps we want to be cautious and send out the AI model’s generated response only if we are highly confident. This ensures our prospects receive answers that are very likely to be accurate. If the model is not confident enough in the answer it has come up with, we might instead want to have a human review it. To address this, we might set a high confidence threshold and only allow the generated message to be sent to a prospect if the probability of being confident is above, say 0.95.

Deciding the threshold value for decision-making is a critical technique used in classification tasks. It involves setting a cutoff point to differentiate between different classes. This threshold is crucial as it balances precision (avoiding false positives) and recall (identifying true positives). The relative real-world cost of false positive vs false negative predictions is highly domain-specific and dictated by business needs, for which we need to strike an optimal balance by adjusting the threshold.

Incorporating LLMs in the Prediction Stage

The threshold cut-off for an ML model is decided by just one value and only changes rarely once it is decided upon. This is where LLMs can come in –  and act as an extra layer of more intelligent, dynamic, and contextual thresholding. LLMs have an innate ability to understand and interpret complex, nuanced contexts. With their advanced natural language processing capabilities, LLMs can examine the contextual intricacies within the data, leading to more contextually informed and dynamic thresholding decisions.


Tying it back to our AI model example where a response is produced for the prospect’s message in addition to a confident/non-confident set of probability scores for that generated message, instead of classifying a quite confident response with probability 0.94 as not confident (since it is less than a conservative static threshold of  0.95), we could send all responses in a specific confidence range (for example, 0.9 to 0.95) to an LLM and ask it if it is an appropriate message to send or not. This range entails requests for which the model is decently confident but not confident enough to surpass the threshold value. This hybrid system has various advantages:

  • It uses well-trained, pre-existing, and reliable deep-learning models to make classifications that yield accurate results.

  • An ensemble of the existing ML model and LLM uses the general reasoning capabilities of the LLM in conjunction with the task-specific abilities of the existing ML model, avoiding dependence on the exact static threshold value for the outcome.

  • It embeds intelligent verification using LLMs for cases close to the threshold. This could enable better coverage while keeping precision similar.

  • Although an LLM call costs more than inference from an in-house, trained ML model, it's still orders of magnitude cheaper than human verification.

In our use case, this approach enabled us to positively classify and automate 75% of cases that were lower than the threshold and would have otherwise been classified negatively. We achieved this increase in recall while maintaining a similar precision rate, thereby not affecting the quality of positive outcomes while increasing their volume. 

At the same time, it is also essential to consider potential trade-offs that this system ends up making:

  • Integrating LLMs into existing pipelines increases the system's complexity, potentially making it more challenging to maintain, debug, and improve the models over time.

  • The use of LLMs, especially in real-time applications, introduces latency, and processing the additional layer of LLM analysis can slow down the response time, which might be critical in time-sensitive scenarios.

  • There is a dependency on the providers of LLMs for data privacy policies, pricing, security, and performance. Ensuring compliance with data protection regulations becomes extremely important and complicated.

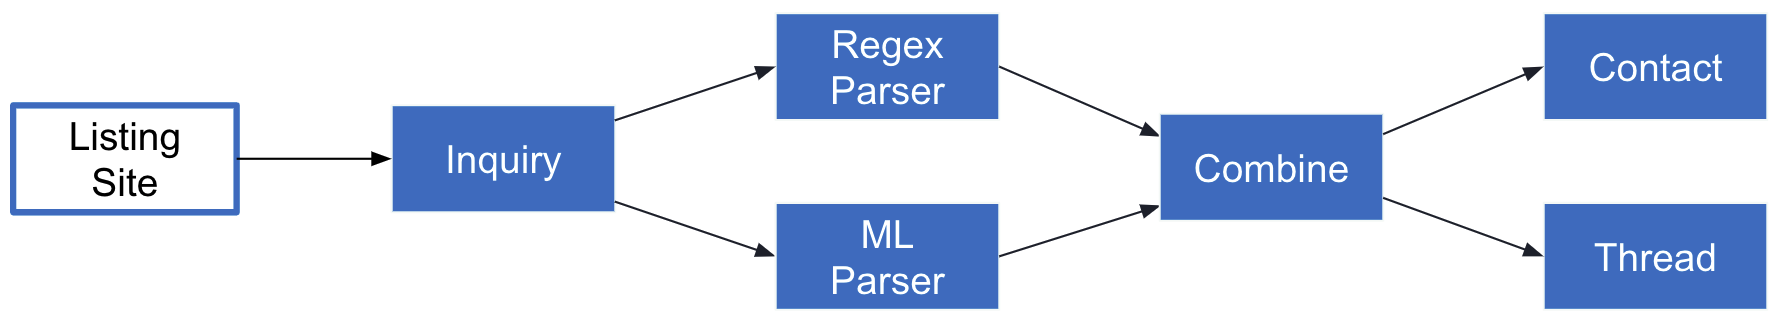
Hybrid ml workflow: Flowchart of how an existing machine learning model is augmented with a large language model to ensure quality responses in a dynamic, context-aware system

Integrating LLMs into traditional ML workflows offers a balanced approach, combining existing models' reliability with LLMs' contextual intelligence. However, there is no free lunch. Organizations must weigh the above-discussed challenges against the potential benefits when considering adopting a hybrid system involving LLMs. Regardless, this emerging hybrid system promises to enhance AI applications, making them more adaptable and responsive to real-world complexities.

Authors and Contributors: Aditya Lahiri, Brandon Davis, Michael Leece, Dimitry Fedosov, Christfried Focke, Tony Froccaro

Revolutionizing PropTech with LLMs

Our flagship product, AppFolio Property Manager (APM), is a vertical software solution designed to help at every step when running a property management business. As APM has advanced in complexity over the years, with many new features and functionalities, an opportunity arose to simplify user actions and drive efficiency. Enter AppFolio Realm-X: the first generative AI conversational interface in the PropTech industry to control APM - powered by transformative Large Language Models (LLMs). 

AppFolio Realm-X

Unlike traditional web-based systems of screens, Realm-X acts as a human-like autonomous assistant to the property manager. Realm-X empowers users to engage with our product through natural conversation, eliminating the need for time-consuming research in help articles and flattening the learning curve for new users. Realm-X can be asked general product questions, retrieve data from a database, streamline multi-step tasks, and automate repetitive workflows in natural language without an instruction manual. With Realm-X, property managers can focus on increasing the scale of their businesses while increasing critical metrics, such as occupancy rates, tenant retention, NOI, and stakeholder satisfaction.

Why LLMs?

Distinguished by their unmatched capabilities, LLMs set themselves apart from traditional Machine Learning (ML) approaches, which predominantly rely on pattern matching and exhibit limited potential for generalization. The distinctive features of LLMs include:

  • Reasoning capabilities: Unlike traditional approaches, LLMs can reason, enabling them to comprehend intricate contexts and relationships.

  • Adaptability to new tasks: LLMs can tackle tasks without requiring task-specific training. This flexibility allows for a more streamlined and adaptable approach to handling new and diverse requirements. For example, if we change the definition of an API, we can immediately adapt the model to it. We don’t need to go through a slow and costly cycle of annotation and retraining.

  • Simplifying model management: LLMs eliminate the need to manage numerous task-specific models. This consolidation simplifies the development process, making it easier to maintain and scale.

LLM Pre-training and Fine-tuning

The first step in creating an LLM is the pre-training stage. Here, the model is exposed to diverse and enormous datasets encompassing a significant fraction of the public internet, commonly using a task such as next-word prediction. This allows it to draw on a wealth of background knowledge about language, the world, entities, and their relationships - making it generally capable of navigating complex tasks.

After pre-training, fine-tuning is applied to customize a language model to excel at a specific task or domain. Over the years, we have used this technique extensively (with smaller language models such as RoBERTa) to classify messages within Lisa or Smart Maintenance or extract information from documents using generative AI models like T5. Fine-tuning LLMs makes them practical and also unlocks surprising new emergent abilities - meaning they can accomplish tasks they were never explicitly engineered for.

  1. Instruction following: During pre-training, a model is conditioned to continue to the current prompt. Instead, we often want it to follow instructions so that we can steer the model via prompting.

  2. Conversational: Fine-tuning conversational data from sources such as Reddit imbues the ability to refer back to previous parts of the conversation and distinguish instructions from the text it generated itself and other inputs. This allows users to engage in a back-and-forth conversation to iteratively refine instructions or ask clarifying questions while reducing the vulnerability to prompt injections.

  3. Safety: Most of the fine-tuning process concerns preventing harmful outputs. A model adapted in this way will tend to decline harmful requests.

  4. Adaptability to new tasks: Traditional ML techniques require adaptation to task-specific datasets. On the other hand, fine-tuned LLMs can draw on context and general background knowledge to adapt to new tasks through prompting, known as zero shot. Additionally, one can improve accuracy by including examples, known as few shot, or other helpful context.

  5. Reasoning from context: LLMs are especially suited for reasoning based on information provided together with the instructions. We can inject portions of documents or API specifications and ask the model to use this information to fulfill a query.

  6. Tool usage: Like humans, LLMs exhibit weaknesses in complex arithmetic, precise code execution, or accessing information beyond their training data. However, like a human using a calculator, code interpreter, or search engine, we can instruct an LLM about the tools at its disposal. Tools can dramatically enhance their capabilities and usefulness since many external systems, including proprietary search engines and APIs, can be formulated as tools.

With a generic model with generic capabilities, the problem remains: how do we adapt it so that a user of our software can use it to run their business?

Breaking Down a User Prompt

Once a user enters a prompt in the chat interface, Realm-X uses an agent paradigm to break it into manageable subtasks handled by more specialized components. To break down the prompt into more manageable subtasks, the agent is provided with: 

  1. A description of the domain and the task it has to complete, along with general guidelines

  2. Conversation history

  3. Dynamically retrieved examples of how to execute a given task and,

  4. A list of tools

A description of the task and the conversation history defines the agent's environment. It allows users to refine or follow up on previous prompts without repeating themselves. Because we provide the agent with a set of known scenarios, the agent can retrieve the ones most relevant to the current situation – improving reliability without polluting the prompt with irrelevant information. 

The agent must call relevant tools, interpret their output, and decide the next step until the user query is fulfilled. Tools encapsulate specific subtasks like data retrieval, action execution, or even other agents. They are vital because they allow us to focus on a subset of the domain without overloading the primary prompt. Additionally, they allow us to parallelize the development process, separate concerns, and isolate different parts of the system. We allow the agent to select tools and generate their input - and tools can even be dynamically composed – such that the output of a tool can be the input for the next.

Generally, a tool returns: 

  1. Structured data to be rendered in the UI

  2. Machine-readable data to be used for automation tasks

  3. A string that summarizes the result to be interpreted by the main agent (and added to the conversation history)

Realm-X in Action

Let’s look at an example of tools in action through two requests Realm-X receives via a single, natural language prompt. A more in-depth analysis of tools will be explored in later posts. The prompt asks Realm-X to 1. Gather a list of residents at their property, The Palms, and 2. Invite the residents via text to a community barbecue on Saturday at 11 AM. 

Realm-X returns a draft bulk message

  • A user can manually update the message or refine it with follow-up prompts

  • Recipients are pre-populated

  • While not displayed above, placeholders can be added to personalize each message

This allows users to quickly create bulk communication, where the reports and content can be customized to many situations relevant to running their business. We aim to expand the capabilities to cover all actions that can be performed inside APM, from sending renewal offers to scheduling inspections. The next step is combining business intelligence and task execution with automation. Our users can put parts of their business on auto-pilot, allowing them to focus their time and energy on building relationships and improving the resident experience rather than on repetitive busy work.

The Road Ahead

Integration of LLMs represents a shift in how we develop software. For one, we don’t have to build custom forms and reports for every use case but can dynamically compose the building blocks. With some creativity, users can even compose workflows we haven’t considered ourselves. We also learned that LLMs are an impartial check on our data and API models – if a model can’t reason its way through, a non-expert human (developer) will also have a hard time. All future APIs must be modeled with an LLM as a consumer in mind, requiring good parameter names, descriptions, and structures representing the entities in our system.

This post only scratches what we can do with this exciting technology. We will follow up with more details surrounding the engineering challenges we encountered and provide a more detailed view into the architectural choices, user experience, testing and evaluation, accuracy, and safety.

Stay tuned!

Authors and Contributors: Chrisftried Focke, Tony Froccaro

Smart Maintenance Conversational AI

If you’re a property manager or a landlord responsible for a portfolio of properties, you know the importance of providing high-quality, prompt maintenance service to your tenants. Maintenance issues - if not dealt with in a timely manner - can affect tenant satisfaction, tenant retention, and ultimately your company’s revenue.

Here we will show how AppFolio’s Smart Maintenance simplifies the maintenance process, helping tenants resolve their maintenance requests conveniently and efficiently. To demonstrate how tenants report maintenance issues using Smart Maintenance, let’s take a look at a hypothetical scenario involving Sandy, a tenant who discovers a clogged drain when doing the dishes after dinner.

Named entity Recognition (NER) used By Smart Maintenance to identify and categorize key information gathered from the conversation


Step 1: Confirming the Tenant's Identity and Address

The first step of Smart Maintenance’s process is to confirm the tenant's identity and address. This is a critical first step because the tenant who is reporting the issue might not be the person who signed the lease, and the property manager needs to know who to contact and where to send the maintenance technician.

To initiate a conversation with Smart Maintenance, a tenant can send a message to our AI-assisted texting interface, or text their property manager who starts the process. In this scenario, Sandy texts Smart Maintenance about her clogged drain directly and does not provide her full name. Because Sandy did not provide her name and address in the initial message, Smart Maintenance will conduct additional information-gathering and respond with follow-up questions to extract that information.

Sandy then replies with her full name and address, and Smart Maintenance uses an identity parsing model to extract and record her contact information and cross-checks it against the value in our database. Throughout this process, there is a human operator overseeing the conversation who can interject at any time - but our AI is automating the operator’s job to a large extent.

Step 2: Identify the Issue

Once Sandy’s contact information is confirmed, Smart Maintenance’s next task is to identify the issue that she is reporting. There are several types of maintenance issues, and each one requires a different course of action to resolve, and with varying urgency. For example, a leaking faucet might need a simple fix, while a broken heater during winter might need an emergency replacement.

Instead of simply providing Sandy with a long list of issues to choose from, or leaving the property manager to guess the issue from Sandy's description, Smart Maintenance uses a machine learning-based model to predict the issue based on her description. If Sandy described the clogged drain succinctly by stating "the kitchen drain is clogged" or in a more roundabout way e.g. "the water is not draining" – Smart Maintenance knows both of her descriptions are referring to the same issue.

We also provide an intuitive user interface for the human operator to review and confirm the issue for an additional layer of confidence. In the rare scenario where the operator finds that the model did not predict the clogged drain accurately, they are provided with the top five predictions that the model believes the issue could be and adjust the prediction accordingly.

Step 3: Gather the Details

After confirming Sandy’s maintenance issue is a clogged drain, Smart Maintenance needs to gather additional details about the drain. These details are necessary to understand the scope, severity, and urgency of the maintenance issue, and further, are used to provide the maintenance technician with the relevant context.

For each maintenance issue submitted to the system, the tenant will be asked a series of troubleshooting questions. These questions are designed to assist the tenant in resolving their issue without sending a maintenance technician, so that simple issues can be resolved promptly. 

If a maintenance technician is needed, Smart maintenance will ask triage questions. Triage questions are meant to determine the urgency of the issue. For Sandy’s clogged drain, the system might ask whether only one drain is clogged, or what the severity is of the drain’s blockage. Additionally, Smart Maintenance inquires as to whether there are any fire, flood, or other hazards associated with the issue. 

Smart maintenance uses another machine learning-based model to turn the tenant’s responses into standardized and structured data that can be easily stored and processed. Smart Maintenance also validates the answers and asks for clarification if the answers are unclear or incomplete.

Steps 4 and 5: Summarize and Close the Issue

After completing all the aforementioned steps, Smart Maintenance uses a summarization model to present the information to a human operator who creates a work order for Sandy’s clogged drain. The summary provided by the issue details model is included in the work order’s description. 

If Sandy is happy with the work order created our closing model will end the conversation based on Sandy’s response. Sandy can also text in later if there is new information, or if she simply wants an update. Our closing model will then re-open the conversation and have operators address Sandy’s questions.

Step 6: Submit the Work Order to the Property Manager and Vendor

With the work order creation finalized by the tenant, Smart Maintenance submits the work order to the property manager. The property manager can now make an informed decision on which vendor is best suited to address Sandy’s problem, in this instance a plumber, and dispatches them to fix the clogged drain.

Once Sandy’s drain is fixed by the plumber, Smart Maintenance continues to optimize the process - handling billing, gathering customer feedback, and even allowing property managers to define rules that will automatically contact vendors based on an issue, the issue’s urgency, and the answers provided by the tenant to the triage questions. 

Overview: How Smart Maintenance Streamlines Operations

Smart Maintenance provides a seamless, user-friendly experience for tenants to report maintenance issues and help manage their maintenance requests more efficiently.

  • Streamlined Issue Reporting: Tenants can simply text or chat to report their maintenance issues, instead of filling out complicated forms or calling an office. They describe their issues in their own words instead of choosing from predefined options while being guided to provide relevant information. This reduces frustration for tenants and encourages them to report issues promptly. 

  • Less Time Investment for Property Management Staff: Smart Maintenance automates repetitive conversations, reduces errors related to data entry, and creates an accurate system of record

  • More Accurate and Complete Issue Identification: Smart Maintenance understands the tenant's description of the issue and is able to discern the issue's severity, frequency, and location of the problem. This helps to avoid miscommunications and ambiguity

  • Quicker and Easier Work Order Creation: Smart Maintenance summarizes the collected information to generate a concise and clear issue description that can be used to create a work order. Property managers can rely on the work orders being accurately submitted and can set rules on how they’ll be notified and how the work is assigned.

  • More Efficient Communication: Smart Maintenance facilitates communication with tenants and vendors, provides updates, and handles notification and assignment of issues. Smart Maintenance also handles common tenant queries, such as ETA requests, feedback, or follow-ups. This can help you improve your transparency and accountability, and keep tenants and vendors satisfied.

Authors and Contributors: Christfried Focke, Ken Graham, Joo Heon Yoon, Shyr-Shea Chang, Tony Froccaro

Building APIs That Delight Customers and Developers

In June of 2022 at the National Apartment Association Conference, AppFolio announced its integration marketplace, AppFolio Stack, to address the increasing demand for integrations with the Property-Tech services our customers use daily to streamline their workflows. AppFolio Stack was carefully designed to address what our primary stakeholders, the customer – an AppFolio Property Management Company, and the partner – a third-party Property-Tech service, state is their number one technical challenge: integrations. In a survey conducted by AppFolio, we found that integrations often create the very same problems they intend to solve: double data entry, extra workflow steps for onsite teams, and data inaccuracies. Below are the key concepts that guided AppFolio Stack’s design, making sure our integrations were done right.

  1. Optimize The Developer Experience From The Get-Go

Every API should be optimized for the developer's experience and ease of use. We use the “Time to Hello World” metric – the time it takes to execute a core functionality of an API (e.g. a user’s first GET request) - to measure our API’s ease of use. Our API documentation’s Getting Started section walks developers through account setup and their first GET request in right around 10 minutes.

Establishing confidence in our platform's ease of use from the get-go, with code samples, straightforward naming conventions, detailed error messages, and strict adherence to OpenAPI specifications provides developers with a familiar experience – optimized for exchanging data as efficiently as possible.

2. Enable Developers to Simulate Live Integrations 

Before going live with customers, we provide our partner developers with a sandbox environment with sample data that is tailored specifically for their use case. For example, if our partner deals with maintenance - the sample data we provide is robust enough to cover the different business models each company has in place for the maintenance domain.

By performing advanced testing against this sandbox environment with sample data that closely mimics the production environment, we set the right expectations for how partners’ software will perform once they enable a connection with real customer data, and increased load. 

3. Rate Limit to Provide Expected Performance 

To ensure all partners can rely on the availability of our system during periods of heavy load, we configure rate limits on a per-second, per-minute, and per-hour basis to prevent network disruptions that may occur once partner-customer connections go live.

We provide detailed error messages when these limits are exceeded -- and through continuous monitoring, we can promptly communicate ways to restructure our partner’s request patterns to improve their querying efficiency. 

Lastly, all rate limits are structured on a customer-partner pair basis. This provides partners with stable performance that is not impacted by adding new partners or enabling new customers for a specific partner.

4. Practice Quality Assurance in Development 

We implement numerous methods for catching errors before our code goes into production. The first line of coverage is unit testing of the source code and Selenium tests to account for any regressions in the UI. By contract testing and leveraging tools such as Postman and Pact, we ensure our integrations continually provide the stable service promised.

Internally, the Stack API is developed as an orchestration of microservices, and this robust contract testing enables us to independently develop each service with the confidence that we would be notified as soon as a code change violates an existing contract.

5. Proactively Monitor and Alert

In an ideal developer environment, users don’t have to report issues and details about what might have caused them. Tools such as NewRelic, DataDog, and Rollbar alert us as soon as any errors or anomalies happen with our customer’s API usage - and we can proactively inform them as soon as the errors occur. 

6. Allow Time to Introduce Breaking Changes

When developing and supporting a complex API platform, change is inevitable. Planning for change enables us to iterate faster while still being able to revisit previous decisions, and add improvements although these could be potentially breaking changes. Our approach is to support partners when transitioning to the new API version while continuing to support old versions throughout their transition. 

7. Maintain Open Lines of Communication With Developers

We are always receptive to feedback and maintain a direct channel of communication with all of our partners using Slack. Whether the input derives from a slack message, or as a result of our internal reporting system, the feedback is shared directly with our team and often results in constructive changes to our API. Through mutual collaboration, improving existing integrations is one of our highest priorities.

Stay tuned for future posts diving deeper into some of the topics touched upon above!


Authors and contributors: Nevena Golubovic and Tony Froccaro

Understanding Invoices with Document AI

At AppFolio, we specialize in helping Property Management Companies to automate their most repetitive, time-consuming, and tedious processes. Accounting-related tasks often check all of these boxes – and one of them is to maintain an accurate system of record for accounts payable and accounts receivable. This is a critical task due to strict federal and state regulations, and to ensure it is carried out accurately our customers use AppFolio’s Property Management (APM) software to enter invoices. However, these bills must be manually entered –  a time-consuming and error-prone process.

To help, we created Smart Bill Entry, a tool powered by state-of-the-art Machine Learning (ML) based models and our Document AI technology. Smart Bill Entry automatically extracts the most important information from the multitude of invoices a Property Manager receives in a given month - and in 2022 alone, we processed over 10 Million invoices. Here we will explore the tools enabling this technology and explain how it works behind the scenes.

Smart Bill Entry

Smart Bill Entry enables Property Managers to upload invoices in PDF format to APM directly via drag and drop, or by forwarding an email to a specific inbox. Once the invoice is uploaded, our ML models automatically extract key information, such as the amount, vendor name, the property’s address, and the invoice number associated with the bill.

We know Property Managers place a heavy emphasis on accuracy to ensure that bills get paid correctly. Based on our estimations, we have found that when manually entering invoices humans are roughly 95-99% accurate, depending on the field. Our model is designed to mirror this accuracy, and we compute calibrated confidence scores for each field to get our models to a state where they are as close to human accuracy as possible.

The model outputs a number between 0 and 1, where a score closer to 1 indicates that the model is confident that the class is correct. However, ML models tend to be over- or under-confident in their predictions, meaning that a given score doesn’t correspond to the probability that the prediction is correct - as demonstrated by the diagram below.

ML models tend to be over or underconfident, such that their confidence scores don’t exactly correspond to the probability that the prediction is correct. we fit additional calibration models To account for this, such that we can make consistent decisions of whether or not to show predictions. Image credit “On Calibration of Modern Neural Networks”

Calibration is the process of transforming the confidence score predicted by the model into a reliable probability that can be used to make decisions, like showing or not showing the prediction to the user. We do this as an added layer of precision. If our calibrated model is returning a confidence score of 0.95 for the “Bill Amount” field, we can expect that the model will be correct 95 times out of 100 predictions.

Document AI

The technology driving Smart Bill Entry’s ability to extract information from PDFs is Document AI. Document AI is a set of Machine Learning tools that are specifically designed for extracting information from a PDF, independent of the layout. The input data used to train our Document AI models includes two types of information: 

  1. The Optical Character Recognition (OCR) information of the documents. This is the typed or written text on a document converted into machine-encoded text. Since we are only interested in fields that are critical to the invoice, we use datasets that zero in on this information.

  2. The bounding box coordinates and content of the target fields we are looking to extract from the documents. We derive labels from these coordinates. To get the labels (e.g. “Vendor Name”, “Property Name”, etc.) for the content of each bounding box, human supervision is necessary - and the operators who assess the content of the invoices assign the appropriate label.

The image below is a visual representation of an invoice, the OCR information identified by the model for that invoice, and what labels would be generated for each object that is present on the invoice. 

Original Invoice vs OCR Information vs Labels

After collecting the OCR and bounding box dataset, we then apply different techniques that combine Computer Vision, Natural Language Processing, and Tabular Features. In the next section, we’ll discuss two of our approaches to extracting the above information, depending on our customer’s specific needs.  

Traditional vs Deep Learning

Smart Bill Entry combines two approaches to extracting information from invoices: traditional Machine Learning solutions and advanced Deep Learning solutions. For example, when extracting the ”Property Address” and the “Vendor Name” fields, we are using tree-based  models customized for each Property Manager. When we extract generic fields, such as the “Amount” and “Invoice Number” we use powerful DL models that can take advantage of layout and text using state-of-the-art Transformer architectures.

Traditional Machine Learning 

We extract the “Property Address” and “Vendor Name” fields from an invoice using traditional ML models. The input data for training the model is a simple Bag-of-words representation of the invoices, together with other engineered features relating to the layout. After extensive benchmarking we landed on a multi-class Random Forest Classifier as our base estimator. It fits several decision tree classifiers on various sub-samples of the dataset and uses averaging to improve predictive accuracy and prevent over-fitting.

Because AppFolio is a Property Management software used by thousands of companies (each with a large number of vendors and properties in their database), training only one multi-class Random Forest Classifier for all the vendors and properties in our database is a very challenging feat due to the high cardinality in the target variable and the challenge of deduplicating entities.

We train separate Random Forest ClassifierS for fields that have a unique set of target classes for each customer.

To tackle this, we decided to train one model per Property Management company. Not surprisingly, the drawback of this approach is that it requires a comprehensive and robust ML infrastructure to efficiently maintain and deploy thousands of models to production, as well as a short cold start phase to learn how to correctly map to specific vendor and property entities. It also means that each individual model needs to be relatively light weight and fast to train.
At AppFolio, we combined in-house solutions with third-party MLOps solutions, to create a state-of-the-art ML infrastructure that helps every team quickly train, deploy and monitor ML models at scale in production. We will talk more about our infrastructure in future posts in this blog.   

Deep Learning

For fields that have well defined labels across all customers such as the “Amount” and “Invoice Number”, we opted for a solution that implements a single Deep Learning model across all Property Management companies as opposed to one model per company. This approach generalizes well to unseen layouts and eliminates cold start issues.

Due to its very high learning capacity we were able to leverage almost all available training data in our database - which lends to our solution producing much more accurate predictions than traditional ML models. We also benchmarked against off the shelf Document AI solutions and found that our models significantly outperform them when evaluated on our holdout data.

Deep Learning Architecture

When deciding which DL architecture to implement for our model, we tried numerous approaches including: 

  • Computer Vision models that use the image of an invoice as their input and output a bounding box for each class

  • Natural Language Processing models that start from the OCR and classify each bounding box according to one of the given classes, and

  • Multimodal models that use as input both the OCR and the image of the invoice. 

We implemented our models in such a way that we can exchange the architecture without modifying the input data and output format. In the image below, we show how different architectures (the yellow boxes in the diagram) can be exchanged without affecting the first and last layers of the model. This gives us the flexibility and agility to test different solutions and optimize our metrics. 

Keeping the input and output fixed we can easily switch between Deep learning architectures to optimize metrics such as accuracy, training and inference time. This also gives us the flexibility to quickly try out new approaches as the field advances.

When considering which architecture to deploy to production, we chose the solution that best balances accuracy with training time and inference speed. We used two processes to evaluate the performance of each model:

1. Offline Evaluation
After training a new model, we compare its performance against a frozen and static dataset that we use as a benchmark.

2. Online Evaluation
After training a new model, we deploy it in shadow-mode, where we do not show the predictions to the user, but rather just record them and compare metrics. 

Stay tuned for a future blog post where we will discuss the details of our ML infrastructure, and how we train, evaluate, deploy and monitor each model!

Authors and contributors: Ezequiel Esposito, Ari Polakof, Christfried Focke, Tony Froccaro

Lisa: Conversational AI

Inspired by PETER STEINER/The New Yorker magazine (1993) “On the internet, nobody knows you’re a dog.” Generated with DALL-E 2 prompt “Dog sitting on a chair in front of a computer with one paw on the keyboard. Comic style, black and white.”

In our last post we discussed the first step in the leasing process driven by Lisa, the Inquiry Parser. Once a message from an Internet Listing Service has been parsed, Lisa’s conversational AI is ready to chat with the prospective resident, either via text or email (we politely decline phone calls 🙂).

Lisa’s “Galaxy Brain”

The primary driver behind Lisa’s conversational AI is what we refer to colloquially as Galaxy Brain or Galaxy (the evolution, and constant intelligence gathering of Brain). Galaxy’s task is framed as multi-label text classification, and it works by converting the conversation into a structured response. We then use this response in Lisa’s logic layer to drive the conversation forward.

The structured response, pictured below, is a set of labels that are accompanied by confidence scores. The labels included in our model are:

  • Intents - Tasks prospective residents want to accomplish

    • “This Thursday works for me”, “Can we do Friday instead?”, “I can no longer make the showing”
      (e.g. accept or counteroffer, reschedule, cancel)

  • Categorical slot values - A piece of information that can be categorized

    •  (e.g. “I’m looking for a 1 bedroom”, “Can I do a virtual showing?”)

  • Requested slots - A piece of information the prospective residents requests from us

    • (e.g. “What's the rent?”, “Do you accept Section 8?”)

  • Acknowledgements - Cordial responses

    • (e.g. “You’re welcome!”, “Thank you for your time.”)

  • Miscellaneous labels - Actions that change the back-end behavior of Lisa

    • (e.g. Mark the thread as spam, have the thread skip the operators’ inbox)

Galaxy Input text (top blue blob) and output response (bottom blue blob). The input text includes current inbound message (red) and conversation history (blue), and the output response includes confidence scores for each label.

The confidence score is a value between 0 and 1 that represents the likelihood that the output of the model is correct, with 1 being the highest. In this instance, because the confidence in SET_TOUR_TYPE_VIRTUAL is high, we would first mark the prospective resident’s preference for virtual tours, and then offer to schedule them a virtual tour. If this score were low, it may be handed off to an operator for review.

While highly accurate, a common problem with deep learning models is that they tend to be overconfident in their predictions. This means that they output a very high (or low) confidence score even if there is high uncertainty associated with the accuracy of the prediction. To adjust for this our model is fit with a set of calibration models, one per label, to map the confidence scores in such a way that they correspond more closely to the probability that the prediction is correct.

For non-categorical slot values, such as names, we use a separate Seq2Seq model similar to Lisa's Inquiry Parser.

NLP models transform the conversation history into a structured conversation state. A logic layer combines the conversation state with information from a Knowledge Base (KB) to compute the next action or response.

How Lisa Responds 

Lisa uses a state-of-the-art Transformers based classifier to map natural language into a structured Conversation State. There is a limit on input text length stemming from the quadratic complexity of the attention mechanism in Transformers, as each token (sub word unit) is queried against all other tokens in the input text. A common limit of Transformers-based models is 512 tokens, and to accommodate for this we simply truncate the beginning of the conversation history, as this portion is typically less relevant to the current turn. Recently, linear attention mechanisms have been developed to greatly increase this length limit, but we haven’t found any significant performance gains.

We also include special tokens indicating the speaker, as well as the local timestamp of when each message was sent. This helps Galaxy, by enabling it to infer information from the pacing of messages, as well as the time of day, day of the week and current month. This can also help overcome ambiguities and aid with prioritizing different parts of the input relevant to the current turn.

We generate confidence scores for each label independent of each other to allow an inbound message to have multiple classifications (i.e. a “multi-label” model). This simple setup also allows us to add new labels without touching the model code, we simply modify the data generation, and the new label will show up after the next retraining.

For example, if a prospect asks “I would like a 2 bedroom and do you accept section 8?”, our model will return a score close to 1 for at least two classes – one for asking about “Section 8” (affordable housing) and another for responding with a “2 bedroom” unit type.

Lisa then interprets this state by combining it with external knowledge to generate the natural language response back to the prospect. We refer to the external knowledge as Lisa’s Knowledge Base (KB), and it includes database lookups (e.g. to determine a property’s Section 8 policy) and API calls to external systems (e.g. to Google Calendar for an agent’s availability).

Here is an example of Galaxy in action. Given a message and its conversation history, Galaxy determines a score for each class. Most classes are irrelevant to this message and thus have very low scores. However, Galaxy identified 2 classes of importance here:

  1. Updating the unit type to 2 bedrooms

  2. The question pertaining to Section 8

When deciding whether the prospect would like a 1 or 2 bedroom apartment, Galaxy paid strong attention to “2 bedroom” in the prospect’s message, but also gave weight to the “1BR” portion in the conversation history. These weights give the class of updating unit type a high score. When judging if there is a Section 8 question, Galaxy gets a strong positive signal from “accept section 8”, but negative signals from the conversations about unit type. This is because prospects don’t tend to mention unit type and Section 8 at the same time. In the end the classifier assigns a positive yet small score to Section 8 class.

Output of the SHAP explainer package for the label SET_UNIT_TYPE_BR2. It shows the importance of each word in the input relating to generating the output score for this label. The colors indicate which parts of the input the model deemed to have positive (red) and negative (blue) contributions. It mostly focuses on the words “2 bedroom” in the last prospect message, but also considers the unit types that Lisa said were available.

Output of the SHAP explainer package for the label SECTION8. It shows the importance of each word in the input relating to generating the output score for this label. The colors indicate which parts of the input the model deemed to have positive (red) and negative (blue) contributions. In this case it mostly focuses on the words “accept section 8?”.

With Lisa’s KB integration we can carry out subsequent actions with our logic layer, such as

  • Mark the desired unit type in the database

  • Answer the question about the Section 8 policy

  • Look up and offer showing slots for the desired unit type

  • Cross sell to a different property if the unit type is not available

The logic layer employs a non-ML, template-based approach to generating responses, instead of letting a ML model decide what template to choose or even generate text end-to-end. We chose this methodology because it gives us more control – without having to re-train the model, we can change how Lisa replies to messages or change the conversation flow, just by making adjustments to the logic. Without this, we would need to retrain operators to continuously correct the model’s behavior until enough data is collected to retrain the model, making iterations slow, error prone, and taxing on operators.

Teaching Lisa

To teach Lisa about the leasing process, we need to collect structured training data from the product – one of the greatest challenges underlying all ML products. We carefully designed Lisa’s logic layer to obtain high-quality data without adding much to operators’ workload. Training a classification model usually requires a labeled dataset, one that has annotated classes for each data point.

In our application, this would mean labeling all the desired classes for each inbound message, several hundred labels per message. Instead of asking our operators to create annotations explicitly, we instead infer labels from their behavior. Our operators’ main job is to reply to prospective residents, and to correct our model’s mistakes if needed. 

We implemented a convenient user interface that can provide structured responses for operators to choose from, so our model can learn directly from what operators do on the job. 

One could say that machines learn what we do, not what we say. The user interface needs to account for different categories of classifications, such as question versus intent, and provide operators with easy ways to generate responses by clicking different buttons or navigating the UI with keyboard shortcuts. 

This machine-human interface blurs the boundaries between machine and human responses. Sometimes the machine bypasses operators entirely, and other times operators ignore the suggestions. However, most of the time, the response lies somewhere in the middle; it could be that the machine gives a strong suggestion and operators simply approve it, or that operators slightly modify it to better suit the conversation flow. 


So are prospective tenants talking to a machine or a human? With Lisa, the line is certainly blurry ¯\_(ツ)_/¯

Authors and contributors: Christfried Focke, Shyr-Shea Chang, Tony Froccaro, Miguel Rivera

Lisa: Parsing Inquiries with Seq2Seq Transformers

In our previous blog post we introduced AppFolio AI Leasing Assistant, Lisa, giving a high-level overview of her capabilities and insight into the value she can offer. One of the key technical components which enables Lisa to perform so effectively is the Inquiry Parser.

What is Lisa’s Inquiry Parser?

The leasing conversation flow is often initiated by a prospective resident submitting an inquiry via an Internet Listing Service (ILS), such as Zillow, Apartments.com, or a private homepage for the property. The first component of Lisa to spring into action in response is the inquiry parser. We use it to extract information from inquiries, and process the data collected to start and facilitate a productive conversation in hopes it will lead to a showing, an application, and finally a signed lease.

Once an inquiry is submitted, Lisa receives an e-mail and parses it. All PII (Personal Identifiable Information) is processed and stored securely and not disclosed to anyone not directly involved in the leasing process. At a minimum, a phone number or email address is required to begin a text conversation with the prospective resident. However, with more information such as the prospect’s full name, their desired move-in date, and their unit type preference, Lisa can streamline the conversation as she doesn’t have to ask for it again.

Other than parsing data pertaining to basic information, source attribution is another key component of the inquiry parser. Lisa determines the source of each inquiry, enabling us to generate reports showing which ILS is driving the most business for property managers. 

The Regex Parser has close to 100% precision, but over time its recall will drop as new listing sites come online, or existing sites change their format. We continue to run the RegEx parser first and then augment it with fields from the ML parser. The parsed info is then used to create new, or update existing contacts and threads.

How Does Lisa’s Inquiry Parser work? 

Because there are hundreds of different listing sites, each with different and evolving formats through which they collect their customer’s data, it is a difficult task to parse the wide array of inbound inquiries to Lisa. Prior to the current iteration, our solution was a file with 4,000 lines of RegEx parsing code, that was frequently amended to keep up with formatting changes or addition of new listing sites. This ended up being a significant time sink and chore for our developers. 

Instead, we opted for a more effective solution. In addition to the RegEx, we added a Machine Learning powered parser that generalizes much better by drawing upon data collected from past listing emails and their parsed fields. Lisa now utilizes a Transformers-based, Seq2Seq (sequence-to-sequence) model to map a message derived from an inquiry into a structured string that makes the data trivial to parse. Transformers are a state of the art class of model architectures for Natural Language Processing (NLP) tasks. We leverage pre-trained language models and fine tune them to focus on specific tasks.

As its name suggests, Seq2Seq models transform a sequence into another sequence. A simple example is transforming a German sentence into French. The Transformer generates a target sequence by analyzing both the input and output generated so far, to determine the next token (sub word unit). With the information learned from pre-training on a very large corpus of data, it only needs a fairly modest amount of task specific training data to achieve strong performance.

An illustration of the activations of the attention mechanism that underpins the Transformer architecture. As we are encoding the word "it", part of the attention mechanism is focusing on "The Animal", and baked a part of its representation into the encoding of that word. Source: The Illustrated Transformer.

In our application, we want to extract information from an ILS message. We input the entirety of a message, and have the model output a structured summary sentence of that message. The following is a sample input and output from our model. The input sequence is the ILS message in the top-most text block, the middle text block contains the generated output sequence, and the bottom-most text-block contains the fully parsed output: 

The input sequence consisting of source domain, email subject and body (we remove URLs and HTML tags before passing it into the model) is mapped to a string that resembles natural language and is trivial to parse. We then check whether each value actually exists in the input (e.g. by regex matching phone numbers), and compute confidence scores for each field.

When generating the text in the middle block, the model decides which word to generate based on its relevance to the input text. To explain the model behavior, this relevance can be visualized as a score from each word in the input, and these scores can be added up to determine the final score for the output word (see images below). For example, to generate a part of the phone number, the model almost exclusively looks at the keyword “Phone” and the number that follows. However, when generating the first name, the model actually looks at multiple sentences in the input that mention the first name, even the email address. By looking at these visualizations we can understand how the model works and when its predictions are likely to be correct or incorrect.

Sample output of the SHAP explainer package. It shows the distribution of overall importance when generating part of the phone number (substring “555” in the green circle). The colors indicate which parts of the input the model deemed to have positive (red) and negative (blue) contributions. In this case the model mainly looked at the keyword “Phone” and the phone number itself.

Sample output of the SHAP explainer package. It shows the distribution of overall importance when generating the potential resident’s first name  (substring “Jon” in the green circle). The colors indicate which parts of the input the model deemed to have positive (red) and negative (blue) contributions. In this case the model mainly looked at the keyword(s) “first name”, “Jon” and “My name is Jon…”. 

We chose this model class because the label generation is straight-forward and performance is strong. Lisa simply maps input to target string, and we do not have to annotate exactly where to copy the data from, as would be required of more traditional token classification models. Lisa can read the input and determine the relevant information. There is also no need to post-process the parsed fields to obtain their canonical representation, such as for dates and phone numbers.

One important catch during data generation is that we have to ensure that the value we want to parse is actually present in the source. Otherwise, the model will tend to generate information that is not present. We implemented the same safeguard as a post-processing step, in order to avoid returning occasional “typos.”

In addition to the possibility of typos, another drawback of Seq2Seq models is that there is no obvious way to generate confidence scores. Seq2Seq models output a whole sequence, with the confidence of each predicted word depending on all the previously predicted words in the sentence. This makes it difficult to get a confidence score for the generated sequence or subsequences. Lisa generates confidence scores based on the similarity between the new ILS message and the messages previously used for training the model, as well as the score of the words from which we extract the information.

Lisa’s ML parser has reduced the number of unparsed inquiries to nearly zero and greatly improved the accuracy of data when conducting source attribution. Additionally, the parser has significantly reduced the workload of our operators, who would have had to parse them manually, and our developers who had to maintain the complex parsing code.

The inquiry parser is just one of many exciting components that make up Lisa. Stay tuned for the next post, as we deep dive into the main driver of our conversational system that will leave you questioning whether or not you are actually speaking to an AI.


Authors and contributors: Christfried Focke, Shyr-Shea Chang, Tony Froccaro, Miguel Rivera

AppFolio’s AI Leasing Assistant, Lisa

Let’s delve into the past and think about the last time you tried to rent an apartment. Hopefully, this doesn’t trigger any painful memories…

  1. First, you went to one of the familiar listing sites — Apartments.com, Zillow, or maybe even Craigslist if you’re the type to live dangerously.

  2. You sent a message or made a phone call to the places that piqued your interest.

  3. You heard back from some of the inquiries, but from others - silence. You might have even ended up on the phone with a grumpy landlord who acted as if you were wasting their time, or with an intern who couldn’t provide you with an ounce of concrete information.

  4. Once you made a connection, you scheduled a showing to take a look at the place. Most likely, this was coordinated over text, email, a phone call, or social media.

  5. You eventually found a place, but you were still left with a lingering sense of doubt. You may have missed out on another fantastic place to rent just because of a communication breakdown.

On paper, the process of finding housing sounds simple and relatively straightforward. However, in practice, it’s often a convoluted process –  one that includes many hardships and unpredictability. In fact, only 5% of all rental inquiries end with the filing of an application. Put shortly, the leasing process often results in a large amount of wasted effort, both for prospective residents and property managers. 

Traditionally, the point of contact for prospective renters has been a leasing agent who engages in time-consuming and repetitive conversations with potential renters. Because so many of these conversations follow a predictable script, AppFolio identified a unique opportunity to streamline the process through automation. 

AppFolio AI Leasing Assistant, Lisa, is AppFolio’s response to this problem. Lisa outsources the repetitive and time-consuming parts of leasing conversations while retaining human operators to cover the long tail and provide training data for future automation. Below is a diagram showcasing the processes Lisa is capable of carrying out, and a mock scenario of Lisa at work.

Typical flow of a leasing conversation, Blue boxes indicate steps that are automated by Lisa.

Initial Onboarding of a Prospective Resident

We’ll start with the customer. George is looking for a new place and browses familiar listing sites. Eventually, he sends out a few inquiries. One of these inquiries makes it to Lisa, who automatically parses out George’s profile information, and stores George’s interest in the property’s sales database. Lisa will also use this information to initiate a text conversation with George in less than one or two minutes.

Answer Questions, Prompt for Sales Information

George has come prepared and wants to ask a series of questions most prospective renters ask when in search of a new home:

“Are pets allowed in the apartment? What is the estimated price of utilities per month? What is the floor plan of the available units?”

Lisa can detect and answer these common questions automatically by drawing on a standardized set of policies the property sets. Lisa will also nudge the conversation forward. She’ll request additional contact information and suggest times when George might come by the apartment for a tour.

LISA CONVERTS THE NATURAL LANGUAGE INTO A STRUCTURED RESPONSE THAT ALLOWS THE LOGIC LAYER TO COMPUTE THE RESPONSE.

Find a Showing Time and Handle Scheduling Conflicts

George would like a showing, but he works long hours and can only attend a showing during the evening or on weekends. This could be a problem, not only for George but also for the property managers, since agents have limited availability on the weekends, and agents are sometimes booked weeks in advance. George tells Lisa his availability and Lisa immediately cross-checks both parties’ schedules to find a time that works.

LISA PARSES THE SHOWING TIME PREFERENCE AND CAN RESPOND TO COUNTEROFFERS.

Lisa’s value proposition should be clear: Lisa can maintain any number of parallel conversations with prospective renters, provide excellent customer service, and free up time for property managers to focus less on the minutiae and more on the big picture. 

Overview: How Does Lisa Work? 

AppFolio retains a staff of operators, who get a chance to review conversations as they unfold, rapidly re-label messages on the fly, and use tools to handle edge cases or language that our current models fail to understand. 

Lisa uses a collection of concepts and models to achieve these outcomes including:

  • A parser for inquiries from Internet Listing Services (ILS)

  • A dialog system that combines

    • Natural Language Understanding (NLU) 

    • Dialogue State Tracking 

    • Policy (a logic layer that combines conversation state and external knowledge to decide the next step) 

    • Template-based Natural Language Generation (NLG)

  • A recommendation system for cross-sells

  • A forecasting model to determine hiring goals and set staffing levels for each shift

Stay tuned as we will discuss each of these components in greater detail as part of a series of blog posts surrounding the nuances and technologies!

Lisa integrates with several external systems via APIs and Natural language.

Authors and contributors: Christfried Focke, Shyr-Shea Chang, Tony Froccaro, Ian Murray

Quality Assurance at AppFolio Property Manager 2021

QA-logo.png

An AppFolio engineering team typically consists of three to five software engineers, a product manager, a UX designer, and a QA engineer. Within our agile-based teams, the QA Engineer is in a unique position. The QA engineer can have a wide range of experience across different domains due to the cross-functional responsibilities that the role requires. Depending on the team and situation, the role’s breadth of knowledge overlaps with the product expert, voice of the customer, developer, product manager, agile coach, scrum master, customer support, and site reliability engineer. Within AppFolio Property Manager (APM), a QA Engineer has the potential to impact their teams much more than in an organization where the QA roles are specialized as a Software Tester, Automation Engineer, or QA Analyst. Great people make a great company is one of our company values and keys to continued success, and it works best when a QA Engineer can contribute as a generalist.

In many organizations the definition of QA Engineer defaults to Tester with distinct spots where they contribute to the development process. They find bugs. They wait for discovery and discussions to happen first. They wait for UX designers to create their mockups and prototypes. They wait for the product manager to decide the features and the team to provide the acceptance criteria. They wait for software engineers to write the code. They wait for their turn in the product development process. They wait for the work to come to them. At AppFolio, we prefer to have the entire team collaborate throughout the product development process with QA Engineers on the team promoting the quality mindset from discovery and design through supporting production applications. 

While quality assurance at other software companies can operate with a singular testing focus, AppFolio’s entire product development process involves QA Engineers. Quality assurance is not an end of the assembly line task for us, it demands constant questioning, discussion, and considerations throughout each sprint. Quality is always at the forefront of the QA Engineer’s mind, not only during the testing phase. We look for curious and creative individuals with diverse backgrounds and problem-solving abilities, knowing that they will influence and shape our product development process and idea of quality. When it comes to maintaining quality in our engineering organization, our QA Engineers’ domains for quality should pertain to teams, processes, testing, and people.

The APM QA Engineer Mindset

An important part of the role is understanding the QA mindset at AppFolio. It influences how we approach our work and responsibilities. We find that a quality mindset encompasses more than testing. We emphasize curiosity and creativity. Curiosity compels us to ask “why?” and then continue to ask questions in every step of the development process. Creativity can provide a different outlook when identifying risks and assumptions. A curious and creative QA Engineer can help their team succeed beyond testing. Applying quality at a higher level means a QA Engineer has an impact on addressing the needs around teams, culture, and the organization. The way we see it, a QA Engineer is a servant leader within their team.

The APM QA Engineer as a Servant Leader

As a QA Engineer, servant leadership is integral because we are first and foremost a support role within our engineering teams. QA Engineers do their best to help the team succeed in any way possible. This allows for an open mind to approach any number of issues. We focus on supporting the software engineers, UX designers, and product managers within our team. We also mentor other QA Engineers to reinforce the mindset and culture. It is a positive feedback loop that keeps teams, individuals, and the overall engineering organization growing in a healthy way. A QA Engineer is the glue of the team working in all capacities to figure out how to continually improve communication and facilitate the work being done. We have a commitment to the team’s success. Being a servant leader means wearing different hats and adjusting responsibilities that the role may require as priorities and teams change.

APM QA Engineer Responsibilities

Product Knowledge:

The cornerstone of the best QA Engineers lies in their APM product knowledge. As the product’s scale continues to grow with weekly releases, a team’s QA Engineer becomes more indispensable as a product expert even across features distant from their team’s focus. Product knowledge can also include technical understanding of other apps and services that support APM running smoothly. It has a domino effect. Teams have more context in their domain and can better identify the risks that accompany development there. Additionally, the QA Engineer’s product knowledge minimizes assumptions and potential bugs so when features and functionality are discussed, developed, and tested, there is confidence of due diligence done and clear collaborative efforts in quality through the entire process. By leveraging product knowledge during grooming, testing, and demos we can voice possible user concerns and contribute ideas that result in an overall better user experience.

Identifying risks and reducing assumptions:

Mitigating risks and reducing assumptions doesn’t necessarily mean “test better” when the story is ready to test. That would narrow and limit the QA Engineer’s contributions. Since we are involved in testing and most development phases, it is important to stay in the loop every step of the way. Being involved in team discussions and customer calls during product discovery allows us to contribute to grooming stories and setting weekly goals before any code is written and deployed. Bugs will occur and when they do, we have processes in place to ensure we respond and learn from them both as an individual QA as well as during team retrospectives. As an effective communicator, knowing how to write out bugs not only for developers, but for business teams like onboarding, implementation, and services helps to promote trust and set customer expectations by keeping all stakeholders informed with regular updates. Continually learning the product over time in the role provides the team with a more varied perspective regarding risks and assumptions within the current set of stories groomed.

Testing:

When it comes to testing, a curious and creative QA Engineer will excel with exploratory testing. We use it to surface problems, reduce assumptions, and drive our own learning. We combine an understanding of the user experience, product knowledge, technical skills, and automated tests to deliver features and functionality designated as “done.” The test cases, acceptance criteria, and assumptions are verified at the QA engineer’s discretion and choice of tools. Occasionally, test cases, acceptance criteria, and risks are not obvious, so we value a QA Engineer’s curiosity and creativity to snuff them out and bring them to the team’s attention. Sometimes, this can mean demoing the story with the team to review all changes that will be merged. We firmly believe in this creative approach to testing and every QA Engineer has access to the same tools and environments that a software engineer does. Testing is a review of the team’s combined effort from grooming to release, with the goal of assuring that users receive the best possible experience with new features and functions going into the existing product.

Releases:

Releases fall under QA’s purview in terms of tracking when new features and functionalities are delivered to customers. QA Engineers are the team’s source of truth for release dates, tracking sprints, enabling experimental features (what other companies may call feature flags), and determining which customer segments are included in feature rollouts. QA Engineers can exercise judgment and raise concerns with the team when merging features might pose problems with the user experience, affect migrations, or conflict with other teams’ changes. Being aware of releases means staying cognizant of software updates and maintaining constant watch over quality of the product at large. When it comes to bugs, being able to determine the severity, the dates the bug was released and found, when the fix will reach customers, and whether patching is necessary requires QA Engineers to stay on top of the moving parts of our continuous release cycle. Monitoring production post-release is important to track feature usage data, ensure any exception errors logged are addressed, and make sure new features work as expected.

Technical:

Since we have access to the same tools as our software engineers, technical acumen helps. A basic understanding of Ruby, SQL, databases and migrations, internal tools, Git, and automated tests allows us to support the team better. Git experience allows us to manage the process from merging feature branches, creating release branches, and scheduling deployments to customers. We can cherry-pick bug fixes, schedule releases for non-APM apps, write SQL queries to gather data for the team to inform the decision-making process and check assumptions, and use understanding of automated tests to focus exploratory testing. In some cases, we contribute to technical groomings or code reviews. To go further than that, our knowledge of AWS, infrastructure, and APIs allows us to apply the QA process to backend engineering teams. There is no limit for a QA Engineer to how more technical knowledge can help better serve the team.

Headlights of the Team:

This is the one that may register the least initially, but it comes from being a servant leader. It requires time and experience being immersed in a team to understand the people dynamics, process, and blockers that might appear. It might mean bringing up difficult topics in team retrospectives or in one-to-one meetings. Developing strong communication and empathy helps a QA Engineer understand people, situations, and psychological safety on teams. QA Engineers can also be the one to observe their team’s processes to identify where work is slow, if bugs are affecting productivity, if stories aren’t sliced small enough, and if we are addressing customer feedback adequately. Taking these concerns back to team retrospectives for example will let the team tackle these problems sooner rather than later and not let them grow into major blockers.

Keepers of modern agile:

QA Engineers share the duty to promote a healthy culture and development best practices based on agile guiding principles. While trying to embody these principles, we leverage development to deliver value to customers faster, eschew waterfall development tendencies, and promote AppFolio engineering culture. 

Onboarding and mentoring:

This is an essential part of growing the QA mindset, AppFolio engineering culture, and setting expectations for all QA Engineers joining our company. QA Engineers are not placed on a team by themselves on day one. Rather they have another QA Engineer as their mentor. They learn the product and their role within the team over a span of one to two months of onboarding, setting weekly goals along the way. They learn about the resources, tools, and help at their disposal through pairing often with their mentors. Multiple QA Engineers can pair and track the progress of the new hire over the onboarding period to make sure they are fully supported. Great QA Engineers support each other so that they can learn how to best support teams when they are on their own. The onboarding and mentoring process is never complete and is regularly evaluated. We constantly try to improve it so that new hires are set for success from their first day and during their entire tenure.

Hiring:

The hiring process for QA Engineers is owned by QA team from managers and leads to engineers. QA Engineers involved in interviews constantly ask themselves, what’s going well, what isn’t, and what can we do better with the interview process. We are not afraid to scrutinize our interview structure and exercises. We receive feedback from interviewers and interviewees, and work hard to ensure the people we hire meet our criteria for culture fit, mindset, and career growth. We have open conversations to examine what we can learn from other companies’ interview practices. The interview process usually has multiple parts that evaluate a candidate’s problem-solving ability, willingness to learn, and general creative thinking.


Many responsibilities are listed here and the best among us may be able to do all of the above, but more often than not, it is that a QA Engineer here knows how to adapt and tap into different skills depending on their team or the QA organization’s needs at the moment.

Who We Are

In QA, many of us have quite different backgrounds and are united by our ability to think creatively and curiously. We share the QA mindset even with differing experiences and starting points into the role. The varied responsibilities mentioned in the previous section demonstrate how we bring our range and experiences to QA. Here are a few current QA Engineers’ growth and paths in our organization.

  1. Topher H. began his AppFolio career as a QA Engineer, right after graduation from UCSB with a Computer Engineering degree. His technical background and QA mindset allow him to take ownership and direct our entire production release train. Topher functions as a strong individual contributor on his teams while being invaluable to the QA engineering organization managing significant parts of the QA Engineer interview process and invested in growing the careers of the several QA Engineers reporting to him. Topher works on both feature and infrastructure teams, able to adapt to any team’s given needs. 

  2. Sam P. worked primarily in the Oil & Gas industry before coming to AppFolio. From his previous career and experiences, Sam has a strong background with risk management, data analysis, managing client expectations, developing internal software tools, and project management. Sam leads his team’s technical groomings, comfortable with both navigating the codebase and exploratory testing for testing, releases, and discussions. He currently supports our engineering teams working on machine learning features within the property maintenance space.

  3. Anna G. started out in APM Customer Success and eventually transitioned into the QA Engineer role after a few years. Anna brings a wealth of product knowledge to engineering after spending years directly supporting our customers and their businesses. She is able to identify risks early in the process, knowing how all moving parts of the software work together from the user interface and database. As a tech lead within the accounting domain, many of our engineering teams focused on accounting initiatives benefit from her expertise and advice.

So Anyway…

A QA Engineer has many tools to support other individuals, their teams, and the organization. A successful QA Engineer has not only testing skills, but an aptitude and willingness to improve in other responsibilities and skills, including leadership, culture, ideation, processes, business strategy, computer science, product management, customer service, and hiring to name a few. It is unique and empowering that a QA Engineer at AppFolio has so many avenues for growth.

For a QA Engineer at AppFolio to be successful, a persistent curiosity and willingness to learn are a daily requirement. Each day, week, and month involves a varying degree of responsibility that ranges from mentoring, testing, leading teams, interviewing and hiring, managing projects, collaborating cross-functionally, learning about product improvements, and more. The value of our role lies beyond simply “tester” and has the marks of a generalist that can plunge in and adapt as a specialist depending on the situation. In all instances, quality is our primary concern from top to bottom. We know a little bit of everything and then lean in to where our teams and the organization need us most to ensure we are uplifting those around us to deliver the best they can, including ourselves. Come join us or reach out to learn more. 

Books we have read, referenced, or would suggest:

  • Agile Testing Guide by Lisa Crispin and Janet Gregory

  • Think Fast and Slow by Daniel Kahneman 

  • Dynamic Reteaming by Heidi Helfand

  • The Lean Startup by Eric Ries

  • Creativity, Inc. by Ed Catmull

  • Leaders Eat Last by Simon Sinek

  • Range by David Epstein

  • Inspired: How to Create Products Customers Love by Marty Cagan

  • Good Strategy, Bad Strategy by Richard Rumelt

Using code coverage data to speed up continuous integration and reduce costs

One of the disadvantages of having a large monolith is the tendency to have even small changes take a long time to merge.  At Appfolio, like many other software providers, we are transitioning from a monolith to smaller consumable web services.  However, we have had considerable success in building and maintaining one of the largest monolithic ruby/rails applications that we are aware of and it is not going to disappear anytime soon.   In early 2019 we made it a goal to reduce the amount of time it takes for a developer working on our core monolith to:

  1. Clone the git repository

  2. Install dependencies

  3. Make a trivial change

  4. Start the development server

  5. Run a single test locally

  6. Push a new branch to git

  7. Wait for continuous integration (CI) to run all tests

We call this the “developer loop” and have found that the CI step takes much longer than any other step, initially 53 minutes and 77% of total time.  Given that CI takes most of the time we have invested in reducing our CI run time for the average branch over the last year and a half.   To this end, we have done many things including:

  • Transitioned from Team City to Circle CI

  • Implemented checksum based emulation of tests when the relevant code is unchanged

  • Built a profiler to identify which of our 100+ ci build steps (jobs) are on the CI critical path

  • Increased parallelism

  • Re-thought job dependencies

  • Restricted certain integration tests to release branches only

  • Run only tests related to the change set for a branch

While our success in reducing our developer loop time has come from a combination of all of these factors, the remainder of this article is about the ae_test_coverage gem we have created to collect code coverage data for use in test selection.

Overview

The purpose of this gem is to record per test method code coverage for every test run in the CI environment.  The output is a mapping from source file to test methods.  At Appfolio we use this mapping to select which tests to run based on which files have been modified on a branch.  For a pure ruby application, traditional code coverage using the built in Coverage module would likely be sufficient.  In a Rails web application, the Coverage module on its own is likely not enough to correctly select the super set of tests for a changeset due to extensive metaprogramming used in the Rails framework, non Ruby code such as Javascript, and Ruby code found in .erb template files that is not visible to the Coverage module.  The main contributions of this gem are hooks into the internals of Rails to get additional code coverage information that will give a better approximation of the true code coverage of a test including file types like erb templates, javascript, and stylesheets in addition to handling some of the more common metaprogrammed rails internals like ActiveRecord model attributes and associations that normal code coverage will not catch.

ERB Templates

Ideally, we would be able to collect line coverage data for .erb template files just like we can for ruby files.  Unfortunately, ruby’s built in Coverage module does not collect coverage data for .erb template files.  In a large web application like ours, we have a significant number of Selenium tests where the changes to .erb template files are relevant to the test outcome.  At first thought, it would seem like the lack of line coverage for .erb files would be a deal breaker for coverage based testing in a Rails application.  Fortunately, we can subscribe to ActiveSupport::Notification for !render_template.action_view to figure out exactly which .erb template files were rendered during the course of a test.

Assets (Javascript and Stylesheets)

Of course, javascript and css files are not ruby, therefore ruby’s Coverage module has little hope of determining whether or not their code is used during the course of a test.  For most unit tests, this is not a problem since the javascript and css are not actually evaluated on the server side.  However, in our significant number of selenium tests, changes to css and javascript files are important to what the browser renders and the user actually sees.  While perhaps less of a problem for coverage based test selection than .erb templates, tracking of the assets used during the course of a test will make test selection more reliable.  Similar to how we handled .erb templates, we hooked into the Rails internals to find out when javascript_include_tag or stylesheet_link_tag was used in the process of rendering a template.  This gives us the set of assets rendered during the course of a test.  For an application not using the Sprockets assets pipeline directives, that alone may be enough.   However, applications using the Sprockets asset pipeline will have used sprockets directives to modularize their javascript and css code.  Fortunately, Rails has a way for us to find the set of asset files that were collected into a single asset via sprockets directives and we use this to make sure that we have a complete code coverage mapping for javascript and stylesheet assets to the tests that actually make use of them.

Active Record Models

Consider the Active Record models below

class A < ActiveRecord::Base
    # Attributes:
    # :name
    has_many: :b

    def foo
        return "you called foo"
    end 
end

class B < ActiveRecord::Base
    belongs_to: :a
end

Now consider the following test class that instantiates and references an instance of class A.  

class ModelReferenceTest < Minitest::Test
    def test_coverage_registers_method_call
        a_instance = A.new(name: 'a')
        assert_equal 'you called foo', a_instance.foo
    end

    def test_coverage_registers_attribute_reference
        a_instance = A.new(name: 'a')
        assert_equal 'a', a_instance.name
    end

    def test_coverage_registers_associate_reference
        b_instance = B.new
        a_instance = A.new(name: 'a', b: b_instance)

        assert_equal b_instance, a.b
    end
end

In this simple case ruby’s built in Coverage module will correctly determine that the source file defining class A is used by the test test_coverage_registers_method_call.   However, the Coverage module would not include for source file for class A when test_coverage_registers_attribute_reference is run, because the source code that actually implements the lookup of the value of A.name from the database and the initializer for class A actually live somewhere in the implementation of ActiveRecord::Base.  A test that creates an instance of class A and refers to A.b will have a similar problem because the code that implements has_many is not actually in class A, only the declaration of the has_many relationship.  To handle this and other references to ActiveRecord model attributes and associations, we hook into ActiveRecord to record reads and writes of model attributes and associations. See details here.

Our experience thus far has shown this to be most useful for test selection during refactoring.  For example, if I were to remove the has_many association from class A to class B, then I would want to make sure that all tests that previously had referred to A.b were run when going through CI so that I could leverage CI to find test failures which would lead me to the code that needs to be fixed.

Webpacker Applications

One of the ways we at Appfolio have been trying to tame the growth of our Ruby monolith is to increasingly decouple the front end and the backend via use of API’s and thick javascript applications built in React.  This has led us to use webpacker as part of our asset pipeline which introduces the need to determine whether or not a set of selenium integration tests needs to be run when one of our React applications change.  The webpacker gem provides a javascript_packs_with_chunks_tag helper that is used in a similar way to javascript_include_tag.  However, unlike the javascript_include_tag, we can’t depend on Rails to give us the collection of all assets rolled up in the pack.   To accomplish this we leverage a glob pattern that is generated based on the value that is passed to javascript_packs_with_chunks_tag to account for all source files from the javascript application.  Admittedly, this casts a pretty wide net.  In our CI configuration, we will run all selenium/integration tests that render a link to the javascript app into a response.  However, this is far better than what we were doing before which was to run all selenium/integration tests anytime a webpacker javascript application changed.

Usage in CI

Collecting the code coverage data using ae_test_coverage is only part of the recipe to reduce CI run time.  The other parts are the automation of the collection of code coverage data and the selection of tests.  At this time, the code for this purpose is not part of ae_test_coverage as the code we have written for this purpose is fairly specific to our repository and circle ci workflow.  In this section I describe at a high level how we do it.

Each night, we schedule a run of our entire test suite on the latest master branch commit with ae_test_coverage enabled.  Each of the jobs instrumented with ae_test_coverage creates a per test JSON artifact that lists all of the source code that was used during the execution of the test. (All of this is included in the gem except for the part about scheduling it to run each night).   In our Circle CI config, we have a step that aggregates all of the individual per test code coverage files into a single compressed code coverage artifact which is stored in Circle CI as an artifact of the build.

At the end of the entire workflow, there is an extra job that depends on all other jobs.  If all other jobs have passed and this job runs, it uses the circle ci api to find all of the jobs that preceded it in the workflow and downloads the compressed code coverage artifact for each of the jobs where we are using this code coverage test selection technique.  In some cases we may have 50+ nodes running in parallel for a job and in these cases, we have produced a compressed coverage artifact for each parallel node in that job meaning 50+ downloads for that job alone.  Once all of the compressed per job node coverage artifacts have been downloaded, we decompress and aggregate them together into a reverse mapping where the keys in the map are the paths to source files and the values in the map are the set of test names that use that source file during the course of running the test.  This results in a quite large JSON artifact, ~500MB that we compress down to about 2MB and upload to S3.  This aggregate artifact is used by our CI workflow on every development branch to select relevant tests.

At the beginning of every feature branch’s run through our CI workflow, we download the above mentioned aggregate code coverage artifact for the whole test suite and store it in the circle ci workspace for use by all jobs that follow.  We also take a diff of the feature branch back to where it branched from master and record the set of file names changed on the branch.  The list of changed files is also stored to the Circle CI workspace.  Each subsequent job and parallel node of parallel jobs takes the intersection of the set of tests that would normally be run on that node and the unique set of tests that are found in the coverage data for the set of changed files.  This reduced set of tests is what is actually run during CI.  An artifact listing what files would be run without test selection and what files are actually run is stored for each job node so that it is easy to determine whether or not the test selection has or has not run a specific test file.

Since it is our goal to speed up the development process but still prevent any bugs that may slip through our test selection strategy, we still run all tests on our master branch for every merged pull request and every release candidate.

New Code and New Tests

Of course code is changing all the time and this is especially true in a monolith with 100+ engineers committing to it daily.  This brings up a few issues with coverage based test selection.  First, we don’t have code coverage data for new tests written on a feature branch so we can’t use the techniques described here to select them.  In this case, we have decided to simply always run all modified test files on a branch.   Another problem to consider is how fast stale coverage data begins to result in code coverage based test selection failures where broken tests get to master.   We don’t have great data on this, but anecdotal evidence, from an incident where code coverage data was not updated for nearly a month without anyone noticing, indicates that there was not a significant increase in broken tests getting to master even with a significant amount of new code committed during that time.

Conclusion

Using the technique described in this article, we are able to run the subset of our automated test suite that is most relevant to the changes made on a feature branch.   After implementing this technique for the portions of our test suite that take the most CI resources, we have been able to reduce the average CI cost of a development branch by 25%.  Measuring how much time this has saved the average developer in a highly parallelized CI build environment is more difficult.  We didn’t implement this strategy until after highly optimizing our CI workflow meaning we were already looking for smaller returns by the time we tried this.   What I can say is that before we implemented this technique our build timing looked like this:

  • 5% of builds took < 15 min

  • 27% < 20 min

  • 77% < 25 min

And after:

  • 5% of builds took < 15 min

  • 70% < 20 min

  • 95% < 25 min

In our case the CI cost savings may be more beneficial than the time savings, but your mileage may vary.

How Much Do You Save With Ruby 2.7 Memory Compaction?

If you read this blog recently, you may have seen that Ruby Memory Compaction in 2.7 doesn’t affect the speed of Rails Ruby Bench much. That’s fair - RRB isn’t a great way to see that because of how it works. Indeed, Nate Berkopec and others have criticised RRB for that very thing.

I think RRB is still a pretty useful benchmark, but I see their point. It is not an example of a typical Rails deployment, and you could write a great benchmark centred around the idea of “how many requests can you process at most without compromising latency at all?” RRB is not that benchmark.

But that benchmark wouldn’t be perfect for showing off memory compaction either - and this is why we need a variety of performance benchmarks. They show different things. Thanks for coming to my TED talk.

So how would we see what memory compaction does?

If we wanted a really contrived use case, we’d show the “wedged” memory state that compaction fixes - we’d allocate about one page of objects, free all but one, do it over and over and we’d wind up with Ruby having many pages allocated, sitting nearly empty, unfreeable. That is, we could write a sort of bug reproduction showing an error in current (non-compacting) Ruby memory behaviour. “Here’s this bad thing Ruby can do in this specific weird case.” And with compaction, it doesn’t do that.

Or we could look at total memory usage, which is also improved by compaction.

Wait, What’s Compaction Again?

You may recall that Ruby divides memory allocation into tiny, small and large objects - each object is one of those. Depending on which type it is, the object will have a reference (always), a Slot (except for tiny objects) and a heap allocation (only for large objects.)

The problem is the Slots. They’re slab-allocated in large numbers. That means they’re cheap to allocate, which is good. But then Ruby has to track them. And since Ruby uses C extensions with old C-style memory allocation, it can’t easily move them around once it’s using them. Ruby deals with this by waiting until you’ve free all the Slots in a page (that’s the slab) of Slots, then freeing the whole thing.

That would be great, except… What happens if you free all but one (or a few) Slots in a page? Then you can’t free it or re-use it. It’s a big chunk of wasted memory. It’s not quite a leak, since it’s tracked, but Ruby can’t free it while there’s even a single Slot being used.

Enter the Memory Compactor. I say you “can’t easily move them around.” But with significant difficulty, a lot of tracking and burning some CPU cycles, actually you totally can. For more details I’d recommend watching this talk by Aaron Patterson. He wrote the Ruby memory compactor. It’s a really good talk.

In Ruby 2.7, the memory compactor is something you have to run manually by calling “GC.compact”. The plan (as announced in Nov 2019) is that for Ruby 3.0 they’ll have a cheaper memory compactor that can run much more frequently and you won’t have to call it manually. Instead, it would run on certain garbage collection cycles as needed.

How Would We Check the Memory Usage?

A large, complicated Rails app (cough Discourse cough) tends to have a lot of variability in how much memory it uses. That makes it hard to measure a small-ish change. But a very simple Rails app is much easier.

If you recall, I have a benchmark that uses an extremely simple Rails app. So I added the ability to check the memory usage after it finishes, and a setting to compact memory at the end of its initialisation.

A tiny Rails app will have a lot less to compact - mostly classes and code, so there’s less in a small Rails app. But it will also have a lot less variation in total memory size. Compaction or no, Ruby doesn’t usually free memory back to the operating system (like other dynamic languages), so a lot of what we want to check is whether the total size is smaller after processing a bunch of requests.

A Rails server, if you recall, tends to asymptotically approach a memory ceiling as it runs requests. So there’s still a lot of variation in the total memory usage. But this is a benchmark, so we all know I’m going to be running it many, many times and comparing statistically. So that’s fine.

Methodology

For this post I’m using Ruby 2.7.0-preview3. That’s because memory compaction was added in Ruby 2.7, so I can’t use a released 2.6 version. And as I write this there’s no final release of 2.7. I don’t have any reason to think compaction will change size later, so these memory usage numbers should be accurate for 2.7 and 3.0 also.

I’m using Rails Simpler Bench (RSB) for this (source link). It’s much simpler than Rails Ruby Bench and far more suitable for this purpose.

For now, I set an after_initialize hook in Rails to run when RSB_COMPACT is set to YES and I don’t do that when it’s set to NO. I’m using 50% YES samples and 50% NO samples, as you’d expect.

I run the trials in a random order with a simple runner script. It’s running Puma with a single thread and a single process - I was repeatability far more than I want speed for this. It’s hitting an endpoint that just statically renders a single string and never talks to a database or any external service. This is as simple as a Rails app gets, basically.

Each trial gets the process’s memory usage after processing all requests using Richard Schneeman’s get_process_mem gem. This is running on Linux, so it uses the /proc filesystem to check. Since my question is about how Ruby’s internal memory organisation affects total OS-level memory usage, I’m getting my numbers from Linux’s idea of RSS memory usage. Basically, I’m not trusting Ruby’s numbers because I already know we’re messing with Ruby’s tracking - that’s the whole reason we’re measuring.

And then I go through and analyse the data afterward. Specifically, I use a simple script to read through the data files and compare memory usage in bytes for compaction and non-compaction runs.

The Trials

The first and simplest thing I found was this: this was going to take a lot of trials. One thing about statistics is that detecting a small effect can take a lot of samples. Based on my first fifty-samples-per-config trial, I was looking for a maybe half-megabyte effect in a 71-megabyte memory usage total, and around 350 kilobytes of standard deviation.

Does 350 kilobytes of standard deviation seem high? Remember that I’m measuring total RSS memory usage, which somewhat randomly approaches a memory ceiling, and where a lot of it depends on when garbage collection happened, a bit on memory layout and so on. A standard deviation of 350kb in a 71MB process isn’t bad. Also, that was just initially - the standard deviation goes down as the number of samples goes up, because math.

Similarly, does roughly 500 kilobytes of memory savings seem small? Keep in mind that we’re not changing big allocations like heap allocations, and we’re also not touching cases where Slots are already working well (e.g. large numbers of objects that are allocated together and then either all kept or all freed.) The only case that makes much of a difference is where Rails (very well-tuned Ruby code) is doing something that doesn’t work well with Ruby’s memory system. This is a very small Rails app, and so we’re only getting some of the best-tuned code in Ruby. Squeezing out another half-megabyte for “free” is actually pretty cool, because other similar-sized Ruby programs probably get a lot more.

So I re-ran with 500 trials each for compaction and no compaction. That is, I ran around 30 seconds of constant HTTP requests against a server about a thousand more times, then checked the memory usage afterward. And then another 500 trials each.

Yeah, But What Were the Results?

After doing all those measurements, it was time to check the results again.

You know those pretty graphs I often put here? This wasn’t really conducive to those. Here’s the output of my processing script in all its glory:

Compaction: YES
  mean: 70595031.11787072
  median: 70451200.0
  std dev: 294238.8245869074
--------------------------------
Compaction: NO
  mean: 71162253.14068441
  median: 70936576.0
  std dev: 288533.47219640197
--------------------------------

It’s not quite as pretty, I’ll admit. But with a small amount of calculation, we see that we save around 554 kilobytes (exact: 567,222 bytes) per run, with a standard deviation of around 285 kilobytes.

Note that this does not involve ActiveRecord or several other weighty parts of Rails. This is, in effect, the absolute minimum you could be saving with a Rails app. Overall, I’ll take it.

Did you just scroll down here hoping for something easier to digest than all the methodology and caveats? That’s totally fair. I’ll just add a little summary line, my own equivalent of “and thus, the evil princess was defeated and the wizard was saved.”

And so you see, with memory compaction, even the very smallest Rails app will save about half a megabyte. And as Aaron says in his talk, the more you use, the more you save!

How Do I Use Rails Ruby Bench?

How do I do these explorations with Rails Ruby Bench? How could you do them? There’s full source code, but source code is only one piece of the story.

So today, let’s look at that. The most common way I do it is with AWS, so I’m going to describe it that way. Watch this space for a local version in later weeks!

An Experiment

Rails Ruby Bench is a benchmark, which means it’s mostly useful for experiments in the tradition of the scientific method. It exists to answer questions about performance, so it’s important that I have a question in mind. Here’s one: does Ruby’s new compacting GC make a difference in performance currently? I’ve chosen that question partly because it’s subtle - the answer isn’t clear, and Rails Ruby Bench isn’t a perfect tool for exploring it. That means there will be problems, and backtracking, and general difficulties. That’s not the best situation for easy great results, but it’s absolutely perfect for documenting how RRB works. For a benchmark you don’t want to hear about the happy path. You want to hear how to use it when things are normal-or-worse.

My hypothesis is that compacting GC will make a difference in speed but not a large one. Rails Ruby Bench tends to show memory savings as if it were extra speed, and so if compacting GC is doing a good job then it should speed up slightly. I may prove it or not - I don’t know yet, as I write this. And that’s important - you want to follow this little journey when I still don’t know because you’ll be in the same situation if you do this.

(Do I expect you to actually benchmark changes with Rails Ruby Bench? Probably a few of you. But many, many of you will want to do a benchmarking experiment at some point in your career, and those are always uncertain when you’re doing them.)

AWS Setup, Building an Image

RRB’s canonical measurements are always done using AWS. For the last two-ish years, I’ve always used m4.2xlarge dedicated instances. That’s a way to keep me honest about hardware while giving you access to the same thing I use. It does, however, cost money. I’ll understand if you don’t literally spin up new instances and follow along.

Packer starts to build your image via “packer build ami.json”

Packer starts to build your image via “packer build ami.json”

First you’ll need an image. I already have one built where I can just “git pull” a couple of things and be ready to go. But let’s assume you don’t yet, or you don’t want to use one of my public images. I don’t always keep everything up to date - and even when I do, you shouldn’t 100% trust me to. The glory of open source is that if I screw something up, you can find that out and fix it. If that happens, pull requests are appreciated.

To build an image, first check out the Rails Ruby Bench repo, then cd into the packer directory. You’ll need Packer installed. It’s software to build VM images, such as the AWS Amazon Machine Image you’ll want for Rails Ruby Bench. This lets us control what’s installed and how, a bit like Docker, but without the extra runtime overhead that Docker involves (Docker would, truthfully, be a better choice for RRB if I knew enough about setting it up and also had a canonical hardware setup for final numbers. I know just enough places where it does cause problems that I’m not confident I can get rid of all the ones I don’t know.)

Got Packer installed? Now “packer build ami.json”. This will go through a long series of steps. It will create a small, cheap AWS instance based on one of the standard Ubuntu AMIs, and then install a lot of software that Rails Ruby Bench and/or RSB want to have available at runtime. It will not install every Ruby version you need. We’ll talk about that later.

And after around an hour, you have a Packer image. It’ll print the AMI, which you’ll need.

And after around an hour, you have a Packer image. It’ll print the AMI, which you’ll need.

(If you do Packer builds repeatedly you will get transient errors sometimes - a package will fail to download, an old Ubuntu package will be in a broken state, etc. In most cases you can re-run until it works, or wait a day or two. More rarely something is now broken and needs an update.)

If all goes well, you’ll get a finished Packer image. It’ll take in the neighbourhood of an hour but you can re-use the image as often as you like. Mostly you’ll rebuild when the Ubuntu version you’re using gets old enough that it’s hard to install new software, and you find a reason you need to install new software.

An Aside: “Old Enough”

Not every benchmark will have this problem, but Rails Ruby Bench has it in spades: legacy versions. Rails Ruby Bench exists specifically to measure against a baseline of Ruby 2.0.0-p0. Ruby releases a new minor version every Christmas, and so that version of Ruby is about to turn seven years old, or more than five years older than my youngest kid. It is not young software as we measure it, and it’s hard to even get Ruby 2.0 to compile on Mac OS any more.

Similarly, the version of Discourse that I use is quite old and so are all its dependencies. Occasionally I need to do fairly gross code spelunking to get it all working.

If you have ordinary requirements you can avoid this. Today’s article will restrict itself to 2.6- and 2.7-series Ruby versions. But keep in mind that if you want to use RRB for its intended purpose, sometimes you’re going to have an ugly build ahead of you. And if you want to use RRB for modern stuff, you’re going to see a lot of little workarounds everywhere.

If you ask, “why are you using that Ubuntu AMI? It’s pretty old,” the specific answer is “it has an old enough Postgres to be compatible with the ancient Discourse gems, including the Rails version, while it’s new enough that I can install tools I experiment with like Locust.” But the philosophical answer is closer to “I upgrade it occasionally when I have to, but mostly I try to keep it as a simple baseline that nearly never changes.”

In general, Rails Ruby Bench tries not to change because change is a specific negative in a benchmark used as a baseline for performance. But I confess that I’m really looking forward to Christmas of 2020 when Ruby 3x3 gets released and Ruby 2.0 stops being the important baseline to measure against. Then I can drop compatibility with a lot of old gems and libraries.

You’ll also sometimes notice me gratuitously locking things down, such as the version of the Bundler. It’s the same basic idea. I want things to remain as constant as they can. That’s not 100% possible - for instance, Ubuntu will automatically add security fixes to older distributions, so there’s no equivalent of a Gemfile.lock for Ubuntu. They won’t let you install old insecure versions for more compatibility, though you can use an old AMI for a similar result. But where I can, I lock the version of everything to something specific.

Starting an Image

If you built the AMI above then you have an AMI ID. It’ll look something like this: ami-052d56f9c0e718334. In fact, that one’s a public AMI I built that I’m using for this post. If you don’t want to build your own AMI you’re welcome to use mine, though it may be a bit old by the time you need to do this.

If you like the AWS UI more than the AWS command-line tools (they’re both pretty bad), then you can just start an instance in the UI. But in case you prefer the command-line tools, here’s the invocation I use:

aws ec2 run-instances --count 1 --instance-type m4.2xlarge --key-name noah-packer-1 --placement Tenancy=dedicated --image-id ami-052d56f9c0e718334 --tag-specifications 'ResourceType=instance,Tags=[]'

Dismal, isn’t it? I also have a script in the RRB repo to launch instances from my most recent AMI. That’s where this comes from. Also, you’ll need your own keypair since your AWS account doesn’t have a key called noah-packer-1.

You’ll need to look up the IP address for the instance, and eventually you’ll want the instance ID in order to terminate it. I’m going to trust you to do those things - do make sure to terminate the instance. Dedicated m4.2xlarges are expensive!

Exploration

Once you have the AMI and you can in theory start the AMI, it’s time to think about the actual experiment: what does GC compaction do relative to Rails Ruby Bench? And how will we tell?

In this case, we’re going to run a number of Ruby versions with compaction on and off and see how it changes the speed of Rails Ruby Bench, which means running it a lot on different Ruby versions with different compaction settings.

To gather data, you generally need a runner script of some kind. You’re going to be running Rails Ruby Bench many times and it would be silly (and error-prone!) to do it all by hand.

First, here’s a not-amazing runner script of the kind I used for awhile:

#!/bin/bash -l

# Show commands, break on error
set -e
set -x

rvm use 2.6.5
bundle

for i in ; do
  bundle exec ./start.rb -i 10000 -w 1000 -s 0 --no-warm-start -o data/
done

rvm use 2.7.0-preview2
bundle

for i in ; do
  bundle exec ./start.rb -i 10000 -w 1000 -s 0 --no-warm-start -o data/
done

It’s… fine. But it shows you that a runner script doesn’t have to be all that complicated. It runs bash with -l for login so that rvm is available. It makes sure to break on error - modern Ruby doesn’t get a lot of errors in Discourse, but you do want to know if it happens. And then it runs 30 trials each on Ruby 2.6.5 and Ruby 2.7.0-preview2, each with 10,000 HTTP requests and 1,000 warmup (untimed) HTTP requests, with the default number of processes (10) and threads per process (6).

With this runner script you’re better off using a small number of iterations (30 is large-ish) and running it repeatedly. That way a transient slowdown doesn’t look like it’s all a difficulty with the same Ruby. In general, you’re better off running everything multiple times if you can, and I often do. All the statistics in the world won’t stop you from doing something stupid, and reproducing everything is one way to make sure you didn’t do some kinds of stupid things. At least, that’s something I do to reduce the odds of me doing stupid things.

There’s a better runner to start from now in Rails Ruby Bench. The main difference is that it runs all the trials in a random order, which helps with that “transient slowdown” problem. For GC compaction we’ll want to modify it to run with and without GC compaction for Rubies that have it (2.7-series Rubies) and only with no compaction for 2.6-series Rubies. Here’s what the replacement loop for that looks like:

commands = []
RUBIES.each do |ruby|
  TESTS.each_with_index do |test, test_index|
    invocation_wc = "rvm use # && # && export RUBY_RUNNER_TEST_INDEX=# && #"
    invocation_nc = "rvm use # && # && RUBY_RUNNER_TEST_INDEX=# && #"
    if ruby["2.6."]  # Ruby is 2.6-series?
      commands.concat([invocation_nc] * TIMES)
    else
      commands.concat([invocation_nc,invocation_wc] * TIMES)
    end
  end
end

It’s not simple, but it’s not rocket science. The WITH_COMPACT and NO_COMPACT snippets are already in the runner because it’s not necessarily obvious how to do that - I like to keep that kind of thing around too. But in general you may need some kind of setup code for an experiment, so remember to remove it for the runs that shouldn’t have it. In this case, there’s not a “compaction setting” for Ruby proper, we just run GC.compact manually in an initialiser script. So those snippets create or remove the initialiser script.

The compaction snippets also set an environment variable, RUBY_COMPACT=YES (or NO.) That doesn’t do anything directly. Instead, RRB will remember any environment variable that starts with RUBY for the run so you can tell which is which. I might have done an overnight run and messed that up the first time and had to re-do it because I couldn’t tell which data was which… But in general, if an environment variable contains RUBY or GEM, Rails Ruby Bench will assume it might be an important setting and save a copy with the run data.

For each experiment, you’ll want to either change the runner in-place or create a new one. In either case, it’s just a random script.

I also changed the RUBIES variable to include more Rubies. But first I had to install them.

More Rubies

There are two kinds of Ruby versions you’ll sometimes want to test: prebuilt and custom-built. When I’m testing ordinary Ruby versions like 2.6.0, 2.6.5 or 2.7.0-preview2, I’ll generally just install them with RVM after I launch my AWS instance. A simple “rvm install 2.6.5” and we’re up and running. The new runner script will install the right Bundler version (1.17.3) and the right gems to make sure RRB will run properly. That can be important when you’re testing four or five or eight different Ruby versions - it’s easy to forget to “bundle _1.17.3_ install” for each one.

If you want to custom-build Ruby, there’s slightly more to it. The default Packer build creates one head-of-master custom build, but of course that’s from whenever the Packer image was built. You may want one that’s newer or more specific.

You’ll find a copy of the Ruby source in /home/ubuntu/rails_ruby_bench/work/mri-head. You’ll also find, if you run “rvm list”, that there’s an ext-mri-head the same age as that checkout. But let’s talk about how to make another one.

We’re exploring GC compaction today, so I’m interested in specific changes to Ruby’s gc.c. If you check the list of commits that changed the file, there’s a lot there. For today, I’ve chosen a few specific ones: 8e743f, ffd082 and dddf5a. There’s nothing magical about these. They’re changes to gc.c, a reasonable distance apart, that I think might have some kind of influence on Ruby’s speed. I could easily have chosen twenty others - but don’t choose all twenty because the more you choose, the slower testing goes. Also, with GC compaction I know there are some subtle bugs that got fixed so the commits are all fairly recent. I don’t particularly want crashes here if I can avoid them. They’re not complicated to deal with, but they are annoying. Worse, frequent crashes usually mean no useful data since “fast but crashy” means that version of Ruby is effectively unusable. Not every random commit to head-of-master would make a good release.

For each of these commits I follow a simple process. I’ll use 8e743f to demonstrate.

  1. git checkout 8e743f

  2. mkdir -p /home/ubuntu/ruby_install/8e743f

  3. ./configure —prefix=/home/ubuntu/ruby_install/8e743f (you may need to autoconf first so that ./configure is available)

  4. make clean (in case you’re doing this multiple times)

  5. make && make install

  6. rvm mount -n mri-pre-8e743f /home/ubuntu/ruby_install/8e743f

You could certainly make a script for this, though I don’t currently install one to the Packer image.

And then you’ll need to use these once you’ve built them. Here’s what the top of my runner script looks like:

RUBIES = [
  "2.6.0",
  "2.6.5",
  "ext-mri-head",  # Since I have it sitting around
  "ext-mri-pre-8e743f",
  "ext-mri-pre-ffd082",
  "ext-mri-pre-dddf5a",
]

Nothing complicated in RUBIES, though notice that rvm tacks on an “ext-” on the front of mounted Rubies’ names.

How Does It Run?

If all goes well, the next part is underwhelming. Now we actually run it. I’m assuming you’ve done all the prior setup - you have an instance running with Rubies installed, you have a runner script and so on.

First off, you can just run the runner from the command line, something like “./runner.rb”. In fact I’d highly recommend you do that first, possibly set with only an iteration or two of each configuration, just to make sure everything is working fine. If you have a Ruby installation that doesn’t work or a Rails version not working with a gem you added or a typo in code somewhere, you want to find that out before you leave it alone for eight hours to churn. In RRB’s runner you can change TIMES from 30 down to something reasonable like 2 (why not 1? I sometimes get config bugs after some piece of configuration is done, so 2 iterations is a bit safer.)

If it works, great! Now you can set TIMES back to something higher. If it doesn’t, now you have something to fix.

You can decide whether to keep the data around from that first few iterations - I usually don’t. If you want to get rid of it then delete /home/ubuntu/rails_ruby_bench/data/*.json so that it doesn’t wind up mixed with your other data.

You can just run the runner from the command line, and it will usually work fine. But if you’re worried about network latency or dropouts (my residential DSL isn’t amazing) then there’s a better way.

Instead, you can run “nohup ./runner &”. That tells the shell not to kill your processes if your network connection goes away. It also says to run it in the background, which is a good thing. All the output will go into a file called nohup.out.

If you need to check progress occasionally, you can run “tail -f nohup.out” to show the output as it gets printed. And doing a quick “ls /home/ubuntu/rails_ruby_bench/data/*.json | wc -l” will tell you how many data files have completed. Keep in mind that the runner scripts and RRB itself are designed to crash if anything goes wrong - silent failure is not your friend when you collect benchmark data. But an error like that will generally be in the log.

Processing the Result

# A cut-down version of the JSON raw data format
{
  "version": 3,
  "settings": {
    "startup_iters": 0,
    "random_seed": 16541799507913229037,
    "worker_iterations": 10000,
    (More settings...)
  },
  "environment": {
    "RUBY_VERSION": "2.7.0",
    "RUBY_DESCRIPTION": "ruby 2.7.0dev (2019-11-22T20:42:24Z v2_7_0_preview3~5 8e743fad4e) [x86_64-linux]",
    "rvm current": "ext-mri-pre-8e743f",
    "rails_ruby_bench git sha": "1bba9dbeaa1e02684d8c2ca8a8f9100c90506d5c\n",
    "ec2 instance id": "i-0cf628df3200d5ad5",
    "ec2 instance type": "m4.2xlarge",
    "env-GEM_HOME": "/home/ubuntu/.rvm/gems/ext-mri-pre-8e743f",
    "env-MY_RUBY_HOME": "/home/ubuntu/.rvm/rubies/ext-mri-pre-8e743f",
    "env-rvm_ruby_string": "ext-mri-pre-8e743f",
    "env-RUBY_VERSION": "ext-mri-pre-8e743f",
    "env-RUBYOPT": "-rbundler/setup",
    "env-RUBYLIB": "/home/ubuntu/.rvm/gems/ext-mri-pre-8e743f/gems/bundler-1.17.3/lib",
    (More settings...)
  },
  "warmup": {
    "times": [
      [
        0.177898031,
        0.522202063,
        0.706261902,
        0.372002397,

If you’ve done everything so far, now you have a lot of large JSON files full of data. They’re pretty straightforward, but it’s still easier to use a processing script to deal with them. You’d need a lot of quality time with a calculator to do it by hand!

I do this a lot, so there’s a data-processing script in the Rails Ruby Bench repo that can help you.

First, copy your data off the AWS instance to somewhere cheaper. If you’re done with the instance, this is a decent time to terminate it. Then, copy the RRB script called process.rb to somewhere nearby. You can see this same setup repeatedly in my repository of RRB data. I also have a tendency to copy graphing code into the same place. Copying, not linking, means that the version of the data-processing script is preserved, warts and all, so I know later if something was screwed up with it. The code is small and the data is huge so it’s not a storage problem.

Now, figure out how you’re going to divide up the data. For instance, for this experiment we care which version of Ruby and whether we’re compacting. We can’t use the RUBY_VERSION string because all those pre-2.7.0 Rubies say they’re 2.7.0. But we can use ‘rvm current’ since they’re all mounted separately by RVM.

I handle environment variables by prefixing them with “env” - that way there can’t be a conflict between RUBY_VERSION, which is a constant that I save, with an environment variable of the same name.

The processing script takes a lot of data, divides it into “cohorts”, and then shows information for each cohort. In this case, the cohorts will be divided by “rvm current” and “env-RUBY_COMPACT”. To make the process.rb script do that, you’d run “process.rb -c ‘rvm current,env-RUBY_COMPACT’”.

It will then print out a lot of chunks of text to the console while writing roughly the same thing to another JSON file. For instance, here’s what it printed about one of them for me:

Cohort: rvm current: ext-mri-pre-8e743f, env-RUBY_COMPACT: YES, # of data points: 600000 http / 0 startup, full runs: 60
   0%ile: 0.00542679
   1%ile: 0.01045952148
   5%ile: 0.0147234587
  10%ile: 0.0193235859
  50%ile: 0.1217705375
  90%ile: 0.34202113749999996
  95%ile: 0.4023132304000004
  99%ile: 0.53301011523
  100%ile: 1.316529161
--
  Overall thread completion times:
   0%ile: 44.14102196700001
  10%ile: 49.34424536089996
  50%ile: 51.769418454499984
  90%ile: 54.03600075760001
  100%ile: 56.40413652299999
--
  Throughput in reqs/sec for each full run:
  Mean: 187.45566524151448 Median: 188.96162032049574 Variance: 16.072435858651925
  [177.2919614844611, 178.24351344183614, 180.07540051803122, 180.3893011741887, 180.64734390789422, 180.78633357692414, 180.9370756562659, 181.48759316874003, 181.50042200695788, 181.7831931840077, 181.82136366559922, 182.42668523798133, 182.9695378281489, 183.4271937021401, 183.69630166389499, 185.39624590894704, 186.6188358046953, 186.72653137536867, 187.41516559992874, 187.44972315610178, 187.79211195172797, 188.03560095362238, 188.04550491676113, 188.16079648567523, 188.47720218882668, 188.57493052728336, 188.77093032659823, 188.7810661284267, 188.82632914724448, 188.9600070136181, 188.96323362737334, 189.05603777953803, 189.07694018310067, 189.09085709051078, 189.3054218996176, 189.42953673775793, 189.67879103436863, 189.68938987320993, 189.70449808150627, 189.7789255152989, 189.79846786458847, 189.89027249507834, 189.90364836070546, 189.98443889440762, 190.0304216448691, 190.2516551068254, 190.43172176734097, 190.51420115472305, 190.56095325134356, 190.56496123229778, 190.70854487422903, 190.7499088018249, 190.94577669990025, 191.0250241857314, 191.2679317071894, 191.39842651014004, 191.44203815980674, 191.94534584952945, 193.16205400859081, 193.47628839756382]

--
  Startup times for this cohort:
  Mean: nil Median: nil Variance: nil

What you see there is the cohort for Ruby 8e743f with compaction turned on. I ran start.rb sixty times in that configuration (two batches of 30, random order), which gave 600,000 data points (HTTP requests.) It prints what cohort it is in (the values of “rvm current” and “env-RUBY_COMPACT”). If your window is wide enough you can see that it prints the number of full runs (60) and the number of startups (0). If you check the command lines up above we told it zero startup iterations, so that makes sense.

The top batch of percentiles are for individual HTTP requests, ranging from about 0.005 seconds to around half a second for very slow requests, to 1.3 seconds for one specific very slow request (the 100th-percentile request.) The next batch of percentiles are called “thread completion times” are because the load tester divides the 10,000 requests into buckets and runs them through in parallel - in this case, each load-tester is running with 30 threads, so that’s about 333 consecutive requests each, normally taking in the neighbourhood of 52 seconds for the whole bunch.

You can also just treat it as one giant 10,000-request batch and time it end-to-end. If you do that you get the “throughput in reqs/sec for each full run” above. Since that happened 60 times, you can take a mean or median for all 60. Data from Rails Ruby Bench generally has a normal-ish distribution, resulting in the mean and median being pretty close together - 187.5 versus 189.0 is pretty close, particularly with a variance of around 16 (which means the standard deviation is close to 4, since standard deviation is the square root of variance.)

If you don’t believe me about it being normal-ish, or you just want to check if a particular run was weird, you’ll also get all the full-run times printed out one after the other. That’s sixty of them in this case, so I expect they run off the right side of your screen.

All this information and more also goes into a big JSON file called process_output.json, which is what I use for graphing. But just for eyeballing quickly, I find process.rb’s console output to be easier to skim. For instance, the process_output.json for all of this (ten cohorts including compaction and no-compaction) runs to about six million lines of JSON text and includes the timing of all 600,000 HTTP requests by cohort, among other things. Great for graphing, lousy for quick skimming.

But What’s the Answer?

I said I didn’t know the answer when I started writing this post - and I didn’t. But I also implied that I’d find it out, and I’ve clearly run 600,000 HTTP requests’ worth of data gathering. So what did I find?

Um… That the real memory compaction is the friends we made along the way?

After running all of this for a couple of days, the short answer is “nothing of statistical significance.” I still see Ruby 2.6.5 being a bit slower than 2.6.0, like before, but close enough that it’s hard to be sure - it’s within about two standard deviations. But the 2.7.0 prereleases are slightly faster than 2.6. And turning compaction on or off makes essentially no difference whatsoever. I’d need to run at least ten times as many samples as this to see statistical significance in these thresholds. So if there’s a difference between 2.7 Rubies, or with compaction, at all, it’s quite small.

And that, alas, is the most important lesson in this whole long post. When you don’t get statistical significance, and you’ve checked that you did actually change the settings (I did), the answer is “stop digging.” You can run more samples (notice that I told you to use 30 times and I gave data for 60 times?). You can check the data files (notice that I mentioned throwing away an old run that was wrong?) But in the end, you need to expect “no result” as a frequent answer. I have started many articles like this, gotten “no result” and then either changed direction or thrown them away.

But today I was writing about how to use the tools! And so I get a publishable article anyway. Alas, that trick only works once.

If you say to yourself, “self, this seems like a lot of data to throw away,” you’re not wrong. Keep in mind that there are many tricks that would let you see little or no difference with a small run before doing something large like this. Usually you should look for promising results in small sets and only then reproduce them as a larger study. There are whole fields of study around how to do studies and experiments.

But today I was showing you the tools. And not infrequently, this is what happens. And so today, this is what you see.

Does this mean Ruby memory compaction doesn’t help or doesn’t work? Nope. It means that any memory it saves isn’t enough to show a speed difference in Rails Ruby Bench — but that’s not really what memory compaction is for, even if I wanted to know the result.

Memory compaction solves a weird failure case in Ruby where a single Ruby object can keep a whole page from being freed, resulting in high memory usage for no reason… But Rails Ruby Bench doesn’t hit that problem, so it doesn’t show that case. Basically, memory compaction is still useful in the failure cases it was designed for, even if Rails Ruby Bench is already in pretty good shape for memory density.

Symbol#to_s Returned a Frozen String in Ruby 2.7 previews - and Now It Doesn’t

How a Broken Interface Getting Fixed Showed Us That It's Broken

One of the things I love about Ruby is the way its language design gets attention from many directions and many points of view. A change in the Ruby language will often come from the JRuby side, such as this one proposed by Charles Nutter. Benoit Daloze (a.k.a. eregon), the now-lead of TruffleRuby is another major commenter. And of course, you’ll see CRuby-side folks including Matz, who is still Ruby’s primary language designer.

That bug has some interesting implications… So let’s talk about them a bit, and how an interface not being perfectly thought out at the beginning often means that fixing it later can have difficulties. I’m not trying to pick on the .to_s method, which is a fairly good interface in most ways. But all of Ruby started small and has had to deal with more and more users as the language matures. Every interface has this problem at some point, as its uses change and its user base grows. This is just one of many, many good examples.

So… What’s This Change, Then?

You likely know that in Ruby, when you call .to_s on an object, it’s supposed to return itself “translated” to a string. For instance if you call it on the number 7 it will return the string “7”. Or if you call it on a symbol like :bob it will return the string “bob”. A string will just return itself directly with no modifications.

There are a whole family of similar “typecast” methods in Ruby like to_a, to_hash, to_f and to_i. Making it more complicated, most types have two typecast operators, not one. For strings that would be to_s and to_str, which for arrays it’s to_a and to_ary. For the full details of these operators, other ways to change types and how they’re all used, I highly recommend Avdi Grimm’s book Confident Ruby, which can be bought, or ‘traded’ for sending him a postcard! In any case, take my word for it that there are a bunch of “type conversion operators,” and to_s is one of them.

In Ruby 2.7-preview2, a random Ruby prerelease, Symbol#to_s started returning a frozen string, which can’t be modified. That breaks a few pieces of code. That’s how I stumbled across the change — I do speed-testing on pretty ancient Ruby code regularly, so there are a lot of little potential problems that I hit.

But Why Is That a Problem?

When would that break something? When somebody calls #to_s and then messes with the result, mostly. Here’s the code that I had trouble with, from an old version of ActiveSupport:

    def method_missing(name, *args)
      name_string = name.to_s
      if name_string.chomp!("=")
        self[name_string] = args.first
      else
        bangs = name_string.chomp!("!")

        if bangs
          self[name_string].presence || raise(KeyError.new(":# is blank"))
        else
          self[name_string]
        end
      end
    end

So… Was this a perfectly okay way to do it, broken by a new change? Oooooh… That’s a really good question!

Here are some more good questions that I, at least, didn’t know the answers to offhand:

  • If a string usually just returns itself, is it okay that modifying the string also modifies the original?

  • Is it a problem, optimisation-wise, to keep allocating new strings every time? (Schneems had to work around this)

  • If you freeze the string, which freezes the original, is that okay?

These are hard questions, not least because fixing question #1 in the obvious way probably breaks question #2 and vice-versa. And question #3 is just kind of weird - is it okay to stop this behaviour part way through? Ruby makes it possible, but that’s not what we care about, is it?

I mention this interface, to_s, “not being perfectly thought out” up at the top of this post. And this is what I mean. to_s is a limited interface that does some things really well, but it simply hasn’t been thought through in this context. That’s true of any interface - there will always be new uses, new contexts, new applications where it either hasn’t been thought about or the original design was wrong.

“Wrong?” Isn’t that a strong statement? Not really. Charles Nutter points out that the current design is simply unsafe in the way we’re using it - it doesn’t guarantee what happens if you modify the result, or decide whether it’s legal to do so. And people are, in fact, modifying its result. If they weren’t then we could trivially freeze the result for safety and optimisation reasons and nobody would notice or care (more on that below.)

Also, we’ll know in the future, not just for to_s but for conversion methods in general - it’s not safe to modify their results. I doubt that to_s is the only culprit!

Many Heads and a Practical Answer

In the specific Ruby 2.7 sense, we have an answer. Symbol#to_s returned a frozen string and some code broke. Specifically, the answer to “what broke?” seems to be “about six things, some of them old or obscure.” But this is what trying something out in a preview is for, right? If it turns out that there are problems with it, we’re likely to find them before the final release of 2.7 and we can easily roll this back. Such things have happened before, and will again.

(In fact, it did happen. The release 2.7.0 won’t do this, and they’re rethinking the feature. It may come back, or may change and come back in a different form. The Ruby Core Team really does try to keep backward compatibility where they can.)

In the mean time, if you’re modifying the result of calling to_s, I recommend you stop! Not only might the language break that (or not) later, but you’re already given no guarantees that it will keep working! In general, don’t trust the result of a duplicated object from a conversion method to be modifiable. It might be frozen, or worse it might modify the original object… And yet, it isn’t guaranteed to, or to keep doing it if it already does.

And so the march of progress digs up another problem for us, and we all learn another little bit of interface design together.

Ruby 2.7.0's Rails Ruby Bench Speed is Unchanged from 2.6.0

As of the 25th of December, 2019 we have a released version of Ruby 2.7.0. As you can read in the title - it’s basically the same as 2.6.0.

The 2.7.0 series is remarkable in how little the speed has changed. Overall it has been very stable with very little change in performance. I’ve seen a tiny bit of drift in Rails Ruby Bench results, sometimes as much as 1%-2%, but no more.

The other significant news is also not news: JIT performance is nearly entirely unchanged for Rails apps from 2.6.0. I don’t recommend using CRuby’s MJIT for Rails, and neither does Takashi Kokubun, MJIT’s primary maintainer.

I have a lot of data files to this effect, but… The short version is that, when I run 150 trials of 10,000 HTTP requests each for 2.6.0 versus 2.7.0, the results are well within the margin of error on the measurement. With JIT the results aren’t quite that close, but it’s the same to within a few percent - which means you still shouldn’t turn on JIT for a large Rails app.

I spent some time trying to see if there was a small speedup anywhere in the 2.7 previews that we might have had and missed - there are speed differences of about that size between the fastest and slowest prerelease 2.7 Rubies, which is still very, very small as a span of speeds. And as far as I can tell, no individual change has made a large speed difference, not even 2%. There’s just a very slow drift over time.

Does that mean that Ruby has gotten as fast as it can? Not at all.

Vladimir Makharov (the original author of CRuby’s MJIT) is still working on Mir, a new style of Ruby JIT. Takashi Kokubun is still tuning the existing JIT. I’ve heard interesting things about work from Koichi Sasada on significant reworks of VM subsystems. There are new features happening, and we now have memory compaction.

But I think that at this point, we can reasonably say that the low-hanging performance fruit has been picked. Most speedups from here are going to be more effort-intensive, or require significant architectural changes.

More Fiber Benchmarking

I’ve been working with Samuel Williams a bit (and on my own a bit) to do more benchmarking Fiber speeds in Ruby and comparing them to processes and threads. There’s always more to do! Not only have I been running more trials for each configuration (get that variance down!), I also tried out a couple more configurations of the test code. It’s always nice to see what works well and what doesn’t.

New Configurations and Methodology

Samuel pointed out that for threads, I could run one thread per worker in the master process, for a total of 2 * workers threads instead of using IO.select in a single thread in the master. True! That configuration is less like processes but more like fibers, and is arguably a fairer representation of a ‘plain’ thread-based solution to the problem. It’s also likely to be slower in at least some configurations since it requires twice as many threads. I would naively expect it to perform worse for lack of a good centralised place to coordinate which thread is working next. But let’s see, shall we?

Samuel also put together a differently-optimised benchmark for fibers, one based on read_nonblock. This is usually worse for throughput but better for latency. A nonblocking implementation can potentially avoid some initial blocking, but winds up much slower on very old Ruby when read_nonblock was unusably slow. This benchmark, too, has an interesting performance profile that’s worth a look.

I don’t know if you remember from last time, but I was also doing something fairly dodgy with timing - I measured the entire beginning-to-end process time from outside the Ruby process itself. That means that a lot of process/thread/fiber setup got ‘billed’ to the primitive in question. That’s not an invalid way to benchmark, but it’s not obviously the right thing.

As a quick spoiler on that last one: process setup takes between about 0.3 and 0.4 seconds for everything - running Ruby, setting up the IO pipes, spawning the workers and all. And there’s barely any variation in that time between threads vs processes vs fibers. The main difference between “about 0.3” and “about 0.4” seconds is whether I’m spawning 10 workers or 1000 workers. In other words, it basically didn’t turn out to matter once I actually bothered to measure - which is good, and I expected, but it’s always better to measure than to expect and assume.

I also put together a fairly intense runner script to make sure everything was done in a random order - one problem with long tests is that if something changes significantly (the Amazon hardware, some network connection, a background process to update Ubuntu packages…) then a bunch of highly-correlated tests all have the same problem. Imagine if Ubuntu started updating its packages right as the fiber tests began, and then stopped as I switched to thread tests. It would look like fibers were very slow and prone to huge variation in results! I handle this problem for my important results by re-running lots of tests when it’s significant… But I’m not always 100% scrupulous, and I’ve been bitten by this before. There’s a reason I can tell you the specifics of the problem, right? A nice random-order runner doesn’t keep background delays from happening, but they keep them from all being in the same kind of test. Extra randomly-distributed background noise makes me think, “huh, that’s a lot of variance, maybe this batch of test runs is screwy,” which is way better than if I think, “wow, fibers really suck.”

So: the combination of 30 test-runs per configuration rather than 10 and running them in a random order is a great way to make sure my results are basically solid.

I’ve also run with the October 18th prerelease version of Ruby 2.7… And the performance is mostly just like the tested 2.6. A little faster, but barely. You’ll see the graphs.

Threaded Results

Since we have two new configurations, let’s start with one of them. The older thread-based benchmark used IO.select and the newer one uses a lot of threads. In most languages, I’d now comment how the “lot of threads” version needs extra coordination — but Ruby’s GIL turns out to handle that for us nicely without further work. There are advantages to having a giant, frequently-used lock already in place!

I had a look at the data piecemeal, and yup, on Linux I saw about what I expected to for several of the runs. I saw some different things on my Mac, but Mac can be a little weird for Ruby performance, zigging when Linux zags. Overall we usually treat Linux as our speed-critical deployment platform in the English-speaking world - because who runs their production servers on Mac OS?

Anyway, I put together the full graph… Wait, what?

Y Axis is the time in seconds to process 100,000 messages with the given number of threads

Y Axis is the time in seconds to process 100,000 messages with the given number of threads

That massive drop-off at the end… That’s a good thing, no question, but why is thread contention suddenly not a problem in this case when it was for the previous six years of Ruby?

The standard deviation is quite low for all these samples. The result holds for the other numbers of threads I checked (5 and 1000), I just didn’t want to put eight heavily-overlapped lines on the same graph - but the numbers are very close for those, too.

I knew these were microbenchmarks, and those are always a bit prone to large changes from small changes. But, uh, this one surprised me a bit. At least it’s in a good direction?

Samuel is looking into it to try to find the reason. If he gets back to me before this gets published, I’ll tell you what it is. If not, I guess watch his Twitter feed if you want updates?

Fibrous Results

Fibers sometimes take a little more code to do what threads or processes manage. That should make sense to you. They’re a higher-performance, lower-overhead method of concurrency. That sometimes means a bit more management and hand-holding, and they allow you to fully control the fiber-to-fiber yield order (manual control) which means you often need to understand that yield order (no clever unpredictable automatic control.)

Samuel Williams, who has done a lot of work on Ruby’s fiber improvements and is the author of the Falcon fiber-based application server, saw a few places to potentially change up my benchmark and how it did things with a little more code. Awesome! The changes are pretty interesting - not so much an obvious across-the-board improvement as a somewhat subtle tradeoff. I choose to interpret that as a sign that my initial effort was pretty okay and there wasn’t an immediately obvious way to do better ;-)

He’s using read_nonblock rather than straight-up read. This reduces latency… but isn’t actually amazing for bandwidth, and I’m primarily measuring bandwidth here. And so his code would likely be even better in a latency-based benchmark. Interesting, read_nonblock had horrifically bad performance in really old Ruby versions, partly because of using exception handling for its flow control - a no-no in nearly any language with exceptions.

You can see the code for the original simpler benchmark versus his version with changes here.

It turns out that the resulting side by side graph is really interesting. Here, first look for yourself:

Red and orange are the optimised version, while blue and green are the old simple one.

Red and orange are the optimised version, while blue and green are the old simple one.

You already know that read_nonblock is very slow for old Ruby. That’s why the red and orange lines are so high (bad) for Ruby until 2.3, but then suddenly get faster than the blue and green lines for 2.3 and 2.4.

You may remember in my earlier fiber benchmarks that the fiber performance has a sort of humped curve, with 2.0 being fast, 2.3 being slow and 2.6 eventually getting faster than 2.0. The blue and the green lines are a re-measurement of the exact same thing and so have pretty much exactly the same curve as last week. Good. You can see an echo of the same thing in the way the red and orange lines also get slower for 2.2.10, though it’s obscured by the gigantic speedup to read_nonblock in 2.3.8.

By 2.5, all the samples are basically in a dead heat - close enough that none of them are really outside the range of measurement error of each other. And by 2.6.5, suddenly the simple versions have pulled ahead, but only slightly.

One thing that’s going on here is that read_nonblock has a slight disadvantage compared to blocking I/O in the kind of test I’m doing (bandwidth more than latency.) Another thing that’s going on is that microbenchmarks give large changes with small differences in which operations are fast.

But if I were going to tell one overall story here, it’s that recent Ruby is clearly winning over older Ruby. So our normal narrative applies here too: if you care about the speed of these things, upgrade to the latest stable Ruby or (occasionally, in specific circumstances) later.

Overall Results

The basic conclusions from the previous benchmarks also still hold. In no particular order:

  • Processes get a questionably-fair boost by stepping around the Global Interpreter Lock

  • Threads and Fibers are both pretty quick, but Fibers are faster where you can use them

  • Processes are extremely quick, but in large numbers will eat all your resources; don’t use too many

  • For both threads and fibers, upgrade to a very recent Ruby for best speed

I’ll also point out that I’m doing very little here - in practice, a lot of this will depend on your available memory. Processes can get very memory-hungry very quickly. In that case, you may find that having only one copy of your in-memory data by using threads or fibers is a huge win… At least, if you’re not doing too much calculation and the GIL messes you up.

See why we have multiple different concurrency primitives? There truly isn’t an easy answer to ‘which is best.’ Except, perhaps, that Matz is “not a threading guy” (still true) - and we don’t prefer threads in CRuby. Processes and Fibers are both better where they work.

(Please note that these numbers, and these attitudes, can be massively different in different Ruby implementations - as they certainly are in JRuby!)

JIT and Ruby's MJIT

Arthur Rackham explains Ruby debugging

Arthur Rackham explains Ruby debugging

If you already know lots about JIT in general and Ruby’s MJIT in particular… you may not learn much new in this post. But in case you wonder “what is JIT?” or “what is MJIT?” or “what’s different about Ruby’s JIT?” or perhaps “why in the world did they decide to do THAT?”…

Well then, perhaps I can help explain!

Assisting me in this matter will be Arthur Rackham, famed early-twentieth-century children’s illustrator whose works are now in the public domain. This whole post is adapted from slides to a talk I gave at Southeast Ruby in 2018.

I will frequently refer to TruffleRuby, which is one of the most complex and powerful Ruby implementations. That’s not because you should necessarily use it, but because it’s a great example of Ruby with a powerful and complicated JIT implementation.

What is JIT?

Do you already know about interpreted languages versus compiled languages? In a compiled language, before you run the program you’re writing, you run the compiler on it to turn it into a native application. Then you run that. In an interpreted language, the interpreter reads your source code and runs it more directly without converting it.

A compiled language takes a lot of time to do the conversion… once. But afterward, a native application is usually much faster than an interpreted application. The compiler can perform various optimizations where it recognizes that there is an easier or better way to do some operation than the straightforward one and the native code winds up better than the interpreted code - but it takes time for the compiler to analyze the code and perform the optimization.

A language with JIT (“Just In Time” compilation) is a hybrid of compiled and interpreted languages. It begins by running interpreted, but then notices which pieces of your program are called many times. Then it compiles just those specific parts in order to optimize them.

The idea is that if you have used a particular method many times, you’ll probably use it again many times. So it’s worth the time and trouble to compile that method.

A JITted language avoids the slow compilation step, just like interpreted languages do. But they (eventually) get the faster performance for the parts of your program that are used the most, like a compiled language.

Does JIT Work?

In general, JIT can be a very effective method. How effective depends on what language you’re compiling and what features of that language - you’ll see numbers from 6% to 40% or even more in JavaScript, for instance.

And in fact, there’s an outdated blog post by Benoit Daloze about how TruffleRuby (with JIT) can run a particular CPU-heavy benchmark at 900% the speed of standard CRuby, largely because of its much better JIT (see graph below.) I say “outdated” because TruffleRuby is likely to be even faster now… though so is the latest CRuby.

These numbers are from Benoit Daloze in 2016, see link above

These numbers are from Benoit Daloze in 2016, see link above

And in fact, the most recent CRuby with JIT enabled runs this same benchmark about 280% the speed of older interpreted CRuby.

JIT Tradeoffs

Nothing is perfect in all situations. Every interesting decision you make as an engineer is a tradeoff of some kind.

Compared to interpreting your language, JIT’s two big disadvantages are memory usage and warmup time.

Memory usage makes sense - if you use JIT, you have to have the interpreted version of your method and the compiled, native version. Two versions, more memory. For complicated reasons, sometimes it’s more than two versions - TruffleRuby often has a lot more than two, which is part of why it’s so fast, but uses lots of memory.

A JIT Implementation beset by troubles

A JIT Implementation beset by troubles

In addition to keeping multiple versions of each method, JIT has to track information about the method. How many times was it called? How much time was spent there? With what arguments? Not every JIT keeps all information, but that means a more complicated JIT with better performance will track more information and use more memory.

In addition to memory usage, there’s warmup time. With JIT, the interpreter has to recognize that a method is called a lot and then take time to compile it. That means there’s a delay between when the program starts and when it gets to full speed.

Some JITs try to compile optimistically - to quickly notice that a method is called a lot and compile it. If it does that, it will often compile methods that don’t get called again much, sometimes, which wastes its time. The Java Virtual Machine (JVM) is (in)famous for this, and tends to run very slowly until JIT has finished.

Other JITs compile pessimistically - they compile methods slowly, and only after they have been called many times. This makes for less waste by compiling the wrong methods, but more warmup time near program start before the program is running quickly. There’s not a “right” answer, but instead various interesting tradeoffs and situations.

JIT is best for programs that run for a long time, like background jobs or network servers. For long-running programs there’s plenty of time to compile the most-used methods and plenty of time to benefit from that speedup. As a result, JIT is often counterproductive for small, short-running programs. Think of “gem list” or small Rake tasks as examples where JIT may not help, and could easily hurt.

Why Didn’t Ruby Get JIT Sooner?

A Ruby core developer tests a JIT implementation for stability

A Ruby core developer tests a JIT implementation for stability

JIT’s two big disadvantages (memory usage, startup/warmup time) are both huge CRuby advantages. That made JIT a tough sell.

Ruby’s current JIT, called MJIT for “Method JIT,” was far from the first attempt. Evan Phoenix built an LLVM Ruby JIT long ago that wound up becoming Rubinius. Early prototypes have been around long before MJIT or its at-the-time competitors. JIT in other Ruby implementations (LLVM libs in Rubinius, OMR) have been tried out and rejected many times. Memory usage has been an especially serious hangup. The Core Team wants CRuby to run well on the smallest Heroku dynos and (historically) in embedded environments.

And while it’s possible to tune a JIT implementation to be okay for warmup time, most JIT is not tuned that way. The Java Virtual Machine (JVM) is an especially serious offender here. Since JRuby (Ruby written in Java) is the most popular alternate Ruby implementation, most Ruby programmers think of “Ruby with JIT” startup time as “Ruby with JVM” startup time, which is dismal.

Also, a JIT implementation can be quite large and complicated. The Ruby core team didn’t really want to adopt something large and complicated that they didn’t have much experience with into the core language.

Shyouhei Urabe, a core team member, created a “deoptimization branch” for Ruby that basically proved you could write a mini-JIT with limited memory use, fast startup time and minimal complexity. This convinced Matz that such a thing was possible and opened the door to JIT in CRuby, which had previously seemed difficult or impossible.

Several JIT implementations were developed… And eventually, Vladimir Makarov created an initial implementation for what would become Ruby’s JIT, one that was reasonably quick, had very good startup time and didn’t use much memory — we’ll talk about how below.

And that was it? No, not quite. MJIT wasn’t clearly the best possibility. Vlad’s MJIT-in-development competed with various other Ruby implementations and with Takashi Kokubun’s LLVM-based Ruby JIT. After Vlad convinced Takashi that MJIT was better, Takashi found a way to take roughly the simplest 80% of MJIT and integrate it nicely into Ruby in a way that was easy to deactivate if necessary and touched very little code outside itself, which he called “YARV-MJIT.”

And after months of integration work, YARV-MJIT was accepted provisionally into prerelease Ruby 2.6 to be worked on by the other Ruby core members, to make sure it could be extended and maintained.

And that was how Ruby 2.6 got MJIT in its current form, though still requiring the Ruby programmer to opt into using it.

Making fun of Ruby for not having JIT yet

Making fun of Ruby for not having JIT yet

MJIT: CRuby’s JIT

The MJIT implementation shows early promise

The MJIT implementation shows early promise

MJIT is an unusual JIT implementation: it uses a Ruby-to-C language translator and a background thread running a C compiler. It literally writes out C language source files on the disk and compiles them into shared libraries which the Ruby process can load and use. This is not at all how most JIT implementations work.

When a method has been called a certain number of times (10,000 times in current prerelease Ruby 2.7), MJIT will mark it to be compiled into native code and put it on a “to compile” queue. MJIT’s background thread will pull methods from the queue and compile them one at a time into native code.

Remember how we talked about the JVM’s slow startup time? That’s partly because it rapidly begins compiling methods to native code, using a lot of memory and processor time. MJIT compiles only one method at once and expects the result to take time to come back. MJIT sacrifices time-to-full-speed to get good performance early on. This is a great match for CRuby’s use in small command-line applications that often don’t run for long.

“Normal” JIT compiles inside the application’s process. That means if it uses a lot of memory for compiling (which it nearly always does) then it’s very hard to free that memory back to the system. Ruby’s MJIT runs the compiler as a separate background process - when the compiling finishes, the memory is automatically and fully freed back to the operating system. This isn’t as efficient — it sets up a whole external process for compiling. But it’s wonderful for avoiding extra memory usage.

How To Use JIT

This has mostly been a conceptual post. But how do you actually use JIT?

In Ruby 2.6 or higher, use the “—jit” argument to Ruby. This will turn JIT on. You can also add “—jit” to your RUBYOPT environment variable, which will automatically pass it to Ruby every time.

Not sure if your version of Ruby is high enough? Run “ruby —version”. Need to install a later Ruby? Use rvm, ruby-build or your version manager of choice. Ruby 2.6 is already released as I write this, with Ruby 2.7 coming at Christmastime of 2019.

What About Rails?

Unfortunately, there is one huge problem with Ruby’s current MJIT. At the time I write this in mid-to-late 2019, MJIT will slow Rails down instead of speeding it up.

That’s a pretty significant footnote.

Problems, Worries and Escape Hatches

If you want to turn JIT off for any reason in Ruby 2.6 or higher, you can use the “—disable-jit” command-line argument to do that. So if you know you don’t want JIT and you may run the same command with Ruby 3, you can explicitly turn JIT off.

Why might you want to turn JIT off?

Debugging JIT problems

Debugging JIT problems

  • Slowdowns: you may know you’re running a tiny program like “gem list —local” that won’t benefit from JIT at all.

  • No compiler available: you’re running on a production machine without GCC, Clang, etc. MJIT won’t work.

  • You’re benchmarking: you don’t want JIT because you want predictability, not speed.

  • Memory usage: MJIT is unusually good for JIT, but it’s not free. You may need every byte you can get.

  • Read-Only /tmp Dir: If you can’t write the .c files to compile, you can’t compile them.

  • Weird platform: If you’re running Ruby on your old Amiga or iTanium, there isn’t going to be a supported compiler. You may want to turn JIT off out of general worry and distrust.

  • Known bug: you know of some specific un-fixed bug and you want to avoid it.

What’s My Takeaway?

Telling the playfully frightened children of a once-JITless Ruby

Telling the playfully frightened children of a once-JITless Ruby

If you’re running a non-Rails Ruby app and you’d like to speed it up, test it out with “—jit”. It’s likely to do you some good - at least if the CPU is slowing you down.

If you’re running a Rails app or you don’t need better CPU performance, don’t do anything. At some point in the future JIT will become default, and then you’ll use it automatically. It’s already pretty safe, but it will be even safer with a longer time to try it out. And by then, it’s likely to help Rails as well.

If you have a specific reason to turn JIT off (see above,) now you know how.

And if you’ve heard of Ruby JIT and you’re wondering how it’s doing, now you know!

RubyConf Nashville

Hey, folks! I’d love to call out a little fun Ruby news from RubyConf in Nashville.

Ruby 3.0 and Ruby Core

We’ve been saying for awhile that Ruby 3.0 will ‘probably’ happen next year (2020.) It has now been formally announced that Ruby 3 will definitely happen next year. From the same Matz Q&A, we heard that he’s still not planning to allow emoji operators. 🤷

Additionally, it looks like a lot of “Async” gems for use with Fibers will be pulled into Ruby Core. In general, it looks like there’s a lot of interesting Fiber-related change coming.

Artichoke

I like to follow alternative (non-MRI) Ruby implementations. Artichoke is a Ruby interpreter running in Rust and mruby (an embedded lightweight Ruby dialect, different from normal Ruby). It compiles to WebAssembly, allowing it to be easily embedded and sandboxed in a web page to run untrusted code, or to run under Node.js on a server.

It’s pretty early days for artichoke, but it runs a lot of Ruby code already. They consider any difference in behaviour from MRI to be a bug, which is a good sign. You can play with their in-browser version from their demo page.

Rubyfmt

Rubyfmt, pronounced “Ruby format,” is a Ruby automatic formatter, similar to “go fmt.” If that doesn’t mean anything to you, imagine that you could run any Ruby source file through a program and it would use absolutely standard spacing to reformat it - there could be exactly one way to arrange spaces to format your source file. The benefit is that you can stop arguing about it and just use the one standard way of spacing.

Rubyfmt is still in progress. Penelope Phippen very insistently wants it to be faster before there’s anything resembling a general release. But there’s enough now that it’s possible to contribute and to play with it.

Intern Experience at Appfolio

My experience at Appfolio for the past 5 months has been nothing short of amazing. TL;DR - I've made more friends and participated in more 'extra-curricular' activities than my other two internships combined. If beautiful weather 24/7, programming in paradise, biking, rock climbing, D&D, dancing, or Disney World catch your fancy, read on.

# Day 1

My mentor greeted me at the door with a peach flavored smoothie to welcome me to the team. Everyone I passed by on my first day said 'hi' or waved to all us new hires on our morning tour. My computer already had most of the necessary technologies installed, and I was ready to start programming immediately! Appfolio has a well-organized onboarding program to get new hires familiar with Ruby on Rails and React - if you have no experience coming in, not to worry! You get to build a mini Rails app from the ground up - it takes about 1-2 weeks, but you can also start working on production code in parallel if you want to get your hands dirty and are comfortable with the product! Appfolio also has "Engineering Academy" sessions that they will enroll new hires in for the first few weeks after starting. They are hour-long sessions to help you get familiar with the product, the technologies, and the market around property management. This was definitely the best onboarding process I've ever experienced; it got me up to speed quickly and was a great intro to meet other new hires in the same boat. Even though I thought it was a smooth process, Appfolio is always iterating on it and trying to make it better. My manager asked specifically for input on how it could be improved, and they took my feedback into account almost immediately.

# Work and Customer Impact

My first day was Monday Jun 17. By the end of my 2nd week, I finished onboarding and made my first change to production code! (Adding CA-friendly verbiage to the Financial Diagnostics page). One week later, our team added rent-calculation columns to the Rent Roll report, which is important for property managers in determining their high-revenue units. Three weeks later, we start-to-finished the spreadsheet importer for Fixed Assets, which customers use to import information about movable items like trucks and refrigerators. This tool more than doubled the number of fixed assets in our system, from 40,000 to near 100,000 now in November! It was a dramatic increase in just a couple months. In August we created PDF Invoicing -- creating PDFs of charges that property managers can print out & deliver to tenants who don't have email. This was serious work -- it added a highly-desired feature to our most-trafficked pages: our accounting pages. It required meeting with other teams working on Corporate Accounting to ensure our work integrated with their own new features. By September, we had rolled it out and were responding to feedback. About a month later, about 10% of all customers have used this feature, generating more than 5,000 PDF Invoices with it. These are serious, legally-binding accounting documents, and we finally implemented after fiddling with PDF CSS and modals all the way to linking them to reports and work-orders in Rails!

# Technical Challenges

For those of you reading this and wanting to learn more about challenging problems my team confronts on a regular basis, this section is for you:

Working with Rails engines: Engines are a Rails design pattern that helps segment pieces of the host application into miniature Rails apps called "Engines". This reduces the main app's complexity. However, engines also add a lot of technical overhead: If engine A defines Rails models required by engine B, you need to explicitly "inject" those models into engine B in a special way. Moreover, this makes testing engine B more complex: to test engine B in isolation, you have to make a dummy object within engine B for each injected model. Luckily Appfolio has a whole ‘Engineering Academy’ session to learn how to use engines!

Selenium tests: We have been moving over to React as a frontend instead of Rails server-side-rendered frontends. This means that when the Rails server needs to serve a React page, the app has to load up a bunch of javascript that comprises the React page. In production, this javascript is pre-compiled to speed up its delivery. In local development however, it is not pre-compiled by default. Consequently, my local browser-automation Selenium tests were failing because they were timing out waiting for certain React-powered elements to appear on the page. After some investigation, we discovered that my local machine wasn't pre-compiling the React pages, but instead waiting until test-time to compile and deliver the javascript, which takes so long that the test times-out. We solved it by configuring our local testing environment to pre-compile the React pages. We also found we could speed up our Continuous Integration testing platform (Circle CI) by adding the new React javascript to a list of assets to precompile.

# Extra Curricular Activities

The best thing about Appfolio is the people that work here! Appfolio has cultivated an amazing culture that is collaborative, encouraging, and so much fun. Whenever I have a question, there are plenty of engineers who are excited to answer and take the time to explain new concepts in detail. Everyone in product and dev is open to trying new things that may even take them out of their comfort zone - such as learning Michael Jackson's Thriller dance to flash mob it in public and all over the Appfolio office! And that's not all. In the time that I've been here, I've been able to participate in more activities than I've ever done at a single point in my life:
Appfolio encourages our development teams to visit customers on site. So my team went to visit a customer an hour away in Ventura! We stopped off at a pier and ate some amazing tacos for lunch outside. We have another site visit planned for Camarillo, another town down the coastline.

MVIMG_20190724_154405.jpg

Every Wednesday a group of us Appfolians play soccer during lunch.

We go climbing at the Santa Barbara Rock Gym with other Appfolians after work.

I was able to go to Disneyland for the first time on our tech retreat!

We have hackdays a few times a year where you can make whatever you want.

Tons of Appfolians bike, and there are great trails all around SB. I get to do some fun rides around the area with pro bikers. We've biked downtown to get the best mini cupcakes in the world, we've biked to the next city over to see the beautiful beaches there, and we've biked along the cliffs overlooking the ocean. I also bike to work every day and am always blown away by the view of palm trees and mountains in the distance.

There are plenty of amazing hikes in the area from which you can get a view of the ocean and the mountains all at once!

Some of us also managed to get involved in hip hop and jiu jitsu classes after work at the University of California Santa Barbara campus.

I love Dungeons and Dragons, and another new hire started a group around the same time I started. We fight giants and save (or not) cities every other Monday night.

Once a month, a bunch of Appfolians bring in their favorite board games and play for hours on end after work. Dinner is provided!

Monday nights a group of people join the same server to play Counterstrike Go together. It's a cross-office enterprise - we coordinate with the San Diego office and spend hours in battle. Dinner is also provided!

MVIMG_20190918_130719_1.jpg

Our dev team went on an outing to Santa Cruz island, had a picnic, did some hiking, and tried to find tidepools along the beach.

All of these activities really helped me build great relationships with my co-workers and create a little home-away-from-home. I felt so comfortable learning how to climb, playing soccer with people who actually compete in games, and riding around town with competitive bikers, because the people here are so encouraging and accepting, no matter what skill level I am. Even at work, no matter what knowledge you come in with, Appfolio is a great place for cultivating your skills in a supportive environment. The company culture really focuses on being collaborative (I do a lot of pair programming!), encouraging, fun, and blame-free (if you mess up, you aren't fired, you just get to learn from your mistakes). For example, our team unknowingly made a breaking change to part of the app that generates PDF Invoices for charges. This happened because we changed an API in a separate repo to provide an object instead of an object ID, since we were also in the process of changing the code in our app to expect an object instead of the object ID. However, I Code Reviewed and we merged the JSON API change before we finished CRing and testing the code in our app. Another team who was running through a demo of that portion of the app found the break, and told us about it. We then started brainstorming ways to avoid this type of bug in the future!

# Closing Notes

On your first or second week, you'll be introduced to the rest of the company and asked the question "What is one thing that, if you didn't tell us now, we would never know about you?" When I started, I told everyone that I flash mobbed Thriller with my mom every Halloween in middle and high school. Five months later in October, because of some amazing Appfolians and the support of a very excited VP of engineering, the Thriller dance team went on the road and surprised all of Appfolio with our dance skills. We even barged into a board meeting of all the owners of the company on Halloween and did the dance for them! Hopefully this will become a yearly tradition for the product team! Think of your response to your “fun fact” question wisely, because the answer to this question has the potential to have a very large impact.

ciarra-thriller.jpeg

Ruby's Roots and Matz's Leadership

I recently had the excellent fortune to be invited to a gathering at CookPad in Bristol, where Matz, Koichi, Yusuke Endoh (a.k.a. Mame) and Aaron Patterson all gave great talks about Ruby.

I was especially interested in Matz’s first talk, which was about where he got inspiration for various Ruby features, and about how he leads the language - how and why new features are added to Ruby.

You can find plenty of online speculation about where Ruby is going and how it’s managed. And I feel awkward adding to that speculation — especially since I have great respect for Matz’s leadership. But it seems reasonable to relay his own words about how he chooses.

And I love hearing about how Ruby got where it is. Languages are neat.

You’ll notice that most of Ruby’s influences are old languages, often obscure ones. That’s partly because Ruby itself dates back to 1995. A lot of current languages didn’t exist to get these features from!

Ruby and Its Features

Much of what Matz had to say was about Ruby itself, and where particular features came from. This is a long list, so settle in :-)

The begin and end keywords, and Ruby’s idea of “comb indentation” - the overall flow of if/elsif/else/end - came from the Eiffel language. He mentions that begin/end versus curly-braces are about operator precedence, which I confess I’d never even considered.

On that note, why “elsif”? Because it was the shortest way to spell “else if” that was still pronounced the same way. “elseif” is longer, and “elif” wouldn’t be pronounced the same way.

Then” is technically a Ruby keyword, but it’s optional, a sort of “soft” keyword as he called it. For instance, you can actually use “then” as a method name and it’s fine. You might be forgiven for asking, “wait, what does that do?” The effective answer is “nothing.”

Ruby’s loop structure, with continue, next, break and so on came from C and Perl. He liked Perl’s “next” because it’s shorter than the equivalent C structures.

Ruby’s mixins, mostly embodied by modules, came from Lisp’s Flavors.

Unless” is from Perl. Early on, Ruby was meant as a Perl-style scripting language and many of its early features came from that fact. “Until” is the same. Also, when I talk about Perl here I mean Perl 5 and before, which are very different from Perl 6 - Ruby was very mature by the time Perl 6 happened.

He’s actually forgotten where he stole the for/in loop syntax from. Perhaps Python? It can’t be JavaScript, because Ruby’s use of for/in is older than JavaScript.

Ruby’s three-part true/false/nil with false and nil being the only two falsy values is taken from various Lisp dialects. For some of them there is a “false” constant as the only false value, and some use “t” and “nil” in a similar way. He didn’t say so, but I wonder if it might have had a bit of SQL influence. SQL booleans have a similar true/false/NULL thing going on.

Ruby’s and/or/not operations come straight from Perl, of course. Matz likes the way they feel descriptive and flow like English. As part of that, they’re often good for avoiding extra parentheses.

Matz feels that blocks are the greatest invention of Ruby (I agree.) He got the idea from a 1970s language called CLU from MIT, which called them “iterators” and only allowed them on certain loop constructs.

He took rescue/ensure/retry from Eiffel, but Eiffel didn’t otherwise have “normal” exception handling like similar languages. Ruby’s method of throwing an exception object isn’t like Eiffel, but is like several other older languages. He didn’t mention a single source for that, I don’t think.

He tried to introduce a different style of error handling where each call returns an error object along with its return value from a 1970s language called Icon from the University of Arizona. But after early trials of that method, he thought it would be too hard for beginners and generally too weird. It sounds a lot like what I see of GoLang error handling from his descriptions.

Return came from C. No surprise. Though of course, not multivalue return.

He got self and super from SmallTalk, though SmallTalk’s super is different - it’s the parent object, and you can call any parent method you like on it, not just the one that you just received.

He says he regrets alias and undef a little. He got them from Sather (1980s, UC Berkeley, a derivative language from Eiffel.) Sather had specific labelling for interface inheritance versus implementation inheritance. Ruby took alias and undef without keeping that distinction, and he feels like we often get those two confused. Also, alias and undef tend to be used to break Liskov Substitution, where a child-class instance can always be used as if it were a parent-class instance. As was also pointed out, both alias and undef can be done with method calls in Ruby, so it’s not clear you really need to use keywords for them. He says the keywords now mostly exist for historical reasons since you can define them as methods… but that he doesn’t necessarily think you should always use the methods (alias_method, undefine_method) over the keywords.

BEGIN and END are from Awk originally, though Perl folks know they exist there too. This was also from Ruby’s roots as a system administrator’s scripting language. Matz doesn’t recommend them any more, especially in non-script applications such as Ruby on Rails apps.

C folks already know that __FILE__ and __LINE__ are from the C preprocessor, a standard tool that’s part of the C language (but occasionally used separately from it.)

On Matz and Ruby Leadership

That was a fun trip down memory lane. Now I’ll talk about what Matz said about his own leadership of Ruby. Again, I’m trying to keep this to what Matz actually said rather than putting words in his mouth. But there may be misunderstandings or similar errors - and if so, they are my errors and I apologize.

Matz points out that Ruby uses the “Benevolent Dictator for Life” model, as Python did until recently. He can’t personally be an expert on everything so he asks other people for opinions. He points out that he has only ever written a single Rails application, for instance, and that was from a tutorial. But in the end, after asking various experts, it is his decision.

An audience member asked him: when you add new features, it necessarily adds entropy to the language (and Matz agreed.) Isn’t he afraid of doing too much of that? No, said Matz, because we’re not adding many different ways of doing the same thing, and that’s what he considers the problem with too many language features causing too much entropy. Otherwise (he implied) a complicated language isn’t a particularly bad thing.

He talked a bit about the new pipeline operator, which is a current controversy - a lot of people don’t like it, and Matz isn’t sure if he’ll keep it. He suggested that he might remove or rework it. He’s thinking about it. (Edit: it has since been removed.)

But he pointed out: he does need to be able to experiment, and putting a new feature into a prerelease Ruby to see how he likes it is a good way to do that. The difficulty is with features that make it into a release, because then people are using them.

The Foreseeable Future

Matz also talked about some specific things he does or doesn’t want to do with Ruby.

Matz doesn’t expect he’ll add any new fully-reserved words to the language, but is considering “it” as a sort of “soft”, or context-dependent keyword. In the case of “it” in particular, it would be a sort of self-type variable for blocks. So when he says “no new keywords,” it doesn’t seem to be an absolute.

He’s trying not to expand into emoji or Unicode characters, such as using the Unicode lambda (λ) to create lambdas - for now, they’re just too hard for a lot of users to type. So Aaron’s patch to turn the pipeline operator into a smiley emoji isn’t going in. Matz said he’d prefer the big heart anyway :-)

And in general, he tries hard to keep backward compatibility. Not everybody does - he cites Rails as an example of having lower emphasis on backward compatibility than the Ruby language. But as Matz has said in several talks, he’s really been trying not to break too much since the Ruby 1.8/1.9 split that was so hard for so many users.

What Does That Mean?

Other than a long list of features and where Matz got them, I think the thing to remember is: it’s up to Matz, and sometimes he’s not perfectly expert, and sometimes he’s experimenting or wrong… But he’d love to hear from you about it, and he’s always trying hard and looking around.

As the list above suggests, he’s open to a wide variety of influences if the results look good.

Ruby 2.7preview2, a Quick Speed Update

As you know, I like to check Ruby’s speed for running big Rails apps. Recently, Ruby 2.7 preview2 was released. Normally Ruby releases a new version every Christmas, so it was about time.

I’ve run Rails Ruby Bench on it to check a few things - first, is the speed significantly different? Second, any change in Ruby’s JIT?

Today’s is a pretty quick update since there haven’t been many changes.

Speed and Background

Mostly, Ruby’s speed jumps are between minor versions - 2.6 is different from 2.5 is different from 2.4, but there’s not much change between 2.4.0 and 2.4.5, for instance. I’ve done some checking of this, and it’s held pretty true over time. It's much less true of prerelease Ruby versions, as you’d expect - they’re often still getting big new optimisations, so 2.5’s prereleases were quite different from each other, and from the released 2.5. That’s appropriate and normal.

But I went ahead and speed-checked 2.6.5 against 2.6.0. While these small changes don’t usually make a significant difference, 2.6.0 was one I checked carefully.

And of course, over time I’ve checked how JIT is doing with Rails. Rails is still too tough for it, but there’s a difference in how close do breakeven it is, depending on both what code I’m benchmarking and exactly what revision of JIT I’m testing.

Numbers First

While I’ve run a lot of trials of this, the numbers are fairly simple - what’s the median performance of Ruby, running Discourse flat-out, for this number of samples? This is code I’ve benchmarked many times in roughly this configuration, and it turns out to be well-summarised by the median.

In this case, the raw data is small enough that I can just hand it to you. Here’s my data for 90 runs per configuration with 10,000 HTTP requests per run, with everything else how I generally do it:

Ruby versionMedian reqs/secStd. Dev.Variance
2.6.0174.01.472.17
2.6.5170.11.692.86
2.7.0175.61.632.67
2.7.0 w/ JIT110.41.051.11

One of the first things you’re likely to notice: except for 2.7 with JIT, which we expect to be slow, these are all pretty close together. The difference between 2.6.5 and 2.7.0 is only 5.5 reqs/second, which is a little over three standard deviations - not a huge difference.

I’ve made a few trials, though, and these seem to hold up. 2.6.5 does seem just a touch slower than 2.6.0. The just-about-2% slower that you’re seeing here seems typical. 2.7.0 seems to be a touch faster than 2.6.0, but as you see here, it would take a lot of samples to show it convincingly. One standard deviation apart like this could easily be measurement error, even with the multiple runs I’ve done separately. This is simply too close to call without extensive measurement.

Conclusions

Sometimes when you do statistics, you get the simple result: overall, Ruby 2.7 preview 2 is the same speed as 2.6.0. There might be a regression in 2.6.5, but if so, it’s a small one and there’s a small optimisation in 2.7 that’s balancing it out. Alternately, all these measurements are so close that they may all, in effect, be the same speed.