How Can I Use Ruby 2.6 JIT?

I gave a talk on using JIT in Ruby 2.6 at Southeast Ruby - a great regional conference with a very friendly, cozy vibe. If you get a chance, I highly recommend going next year! It'll be August 1st and 2nd, 2019.

Wondering about what JIT is, how it works and why you'd use it? Or how to try it out in (currently pre-release) Ruby 2.6? Here are my slides. Don't miss the presenter notes, which have extra detail beyond just what's in the slides.


Can I Use Ten 10% Speedups to Make Ruby Instant?

There are a lot of little speedups to Ruby around. I write about a bunch of them. It wouldn't be too hard to collect 100% worth of little 3% and 5% and 10% speedups. Presumably it won't make every Ruby program instant, but what would it do? Heck, Ruby has had way more than ten big speedups over the years. Shouldn't Ruby be instant right now?

Let's talk about how you do performance math - how you check those improvements and how they add up. Then when you find speedup in the wild, you can guess a little about how much they'll help you.

Why Rockets Explode On The Launchpad

When I was a kid, we did a math exercise in class. NASA has a hard job because rockets are complicated. Each piece of a rocket has to be very reliable.

How reliable?

Well, say the pieces are 99.9% reliable and you have 10,000 of them. How likely is it that at least one piece fails and your rocket blows up?

About 99.996% likely to blow up. Don't put anything you care about (like your torso) into a rocket with those numbers. Luckily nobody in my middle school was likely to be an astronaut, so it all worked out.

As a kid, the point was "rockets should blow up all the time. I wonder if I'll get to watch?"

As a crusty old adult, I suggest the lesson, "multiplying over and over does some things you don't expect."

So let's talk performance.

Speeding Up Ruby

It's easy to find little things that give a 5% speedup here or a 10% speedup there in Ruby. For some of them you just upgrade, but others want some configuration.

So what if you added up all of them? What if you grabbed five 10% speedups and ten 5% speedups. That's 100% speedup, so any Ruby code should finish instantly with the right answer, right?

Alas, no. Three 10% speedups sound like they should add up to a 30% speedup. But it's not addition - it's repeated multiplication, like rocket reliability.

Let's talk math, future astronaut.

Let's say you have a Ruby program that takes ten seconds to run and you'd like it faster. You apply one of those 10% speedups, which works perfectly and brilliantly. Now your program runs in 9 seconds. Yay!

So you apply another 10% speedup. Unfortunately, it's not saving you 10% of ten seconds. It's saving you 10% of nine seconds - that other second is gone already. So you save nine tenths of a second, for a runtime of 8.1 seconds, not 8 seconds.

So your speedup isn't 10% + 10% = 20%. Instead, it's 90% of the runtime times 90% of the runtime is 81% of the runtime. So two 10% speedups add up to 19%. And that's why you get 8.1 seconds, not 8 seconds.

Hey, I didn't make the rules.

(There are actually a few cases where they add up to more than that for complicated reasons. Those cases are weird and rare in the real world.)

Except the Real World Sucks

Now if you take two actual 10% speedups and measure the result, you're likely to be disappointed. You often won't get 20% or even 19%. It may be more like 16% or 18%. Sometimes it'll be 10% - both speedups together are exactly as good as just one.

Why?

Sometimes it's because they solve the same problem. If your first optimization is to optimize garbage collection for a 2% speedup, and your second optimization is to turn off garbage collection completely for a 5% speedup, your total will be 5%. That first 2% doesn't do you any good at all.

In general, the more two optimizations "touch", the less their total is going to be. If you save 7%, 10%, 5% and 3% on four different CPU optimizations, it will almost never add up to 23% (note: 0.93 * 0.90 * 0.95 * 0.97 = 0.771, or about 22.9% speedup if they all work together perfectly.) There's generally some overlap between one optimization and another.

But it's worse than that. Because the rocket reliability math is too optimistic.

mountain_dew_bottle.png

Two Liters In Fifteen Seconds: GO!

If you were a mathematically inclined fourteen-year-old with nothing to do, you might decide to try a scientific experiment. Specifically, imagine your parents weren't paying attention for a bit, you could try to roll up as many Dungeons and Dragons characters as possible in a short time. Okay, maybe this is just me. Uh, or some anonymous fourteen-year-old who is only in an example.

You could roll and write out the characters for ten minutes. Let's say you could do about five high-school-quality D&D characters in that time.

But! You discover that by chugging a liter of coffee first, you can get it to six characters in ten minutes. Or with a liter of sprite, five and a half. We'll ignore the character quality, and how many are ripoffs of Drizzt Do'Urden.

So then, how many characters can you write out if you chug a two-liter of Mountain Dew, which combines that much caffeine and twice that much sugar?

A naive additive mathematician would say seven - five characters base, plus one more for the caffeine, plus one more (0.5 * 2) for the sugar. No problem!

A rocket-reliability mathematician would say 6.6 characters (20% speedup plus two 8.3% speedups, 0.8 * 0.917 * 0.917 = 0.673, or 32.7% speedup.)

And our example high-schooler discovers that his hand cramps up after six, plus the walls are now vibrating.

Operations Theory: The Academic Study of "This Class is Pass/Fail"

As our hand-cramp math suggests, you can optimize a particular problem all you like... And it'll help, right up until it doesn't. Mountain-Dew-fueled creativity doesn't help if your hand cramps first.

At any given time there will be one part of the program slowing you down ("the bottleneck.") If you can speed it up until something else is the slow part, any further speedup is wasted. Congratulations! You succeeded! All extra credit is rounded down to zero. Each bottleneck is pass/fail. Pass your papers forward and don't talk to your neighbor.

For instance, let's say your current bottleneck is shoving enough network packets through. It's about 7% slower than whatever your next bottleneck is. If you can find ten different ways to cut your network traffic by 5% each, then they should combine to give you... about 7% speedup. Because now the problem is the next bottleneck, and it really doesn't matter how fast or small your network packets are. Next!

If this sounds simple, I recommend using the phrase "Operations Theory" to describe it and mentioning that it comes from Eliyahu Goldratt's 1984 book "The Goal" (which it does.) Doesn't it sound fancier now?

It's also not quite this simple, as a skilled profiler can tell you. If you speed up an already-fast part of the program, it won't usually give you zero speedup. It'll usually just give you a very small one. That's one of the weird ways two small optimizations can add up to a big one - a big optimization to something that's not currently your bottleneck may turn into a really important optimization... If the bottleneck changes.

By the way - this is also why you should be careful adding up several small optimizations that work well right now. If they're currently giving good speedups, it's probably because they're related to your current bottleneck. Which means when that bottleneck is solved, they'll all turn into tiny (or zero) speedups.

So the Conclusion Is... It's Complicated

This is why it's hard to predict what five different 5% speedups add up to. How much do they overlap? Are they in bottlenecks in your program? If one of them changes the bottleneck, would one of the other speedups suddenly matter more?

I solve this by measuring with a big end-to-end performance test. That's inconvenient, but it changes "it's complicated" to "it's slow and takes a bunch of computer time."

But when people suggest just taking all the known speedups and putting them together, keep in mind that that can be complicated. If you're adding speedups into the core language, great! That means they're constantly tested together. If you're talking about rarely-used tuning knobs, those get complicated fast when you combine them.


Ruby's Global Method Cache

Hey, folks! Lately I've been exploring Ruby environment settings and how much they can help (or not) your app speed. I feel like I've already hit most of the major tuning knobs on Ruby at one point or another... But let's look at one I haven't yet: Ruby's global method cache. What is it? How do you set it? How much speed does it give?

What's the Global Method Cache?

When you use a particular method, Ruby has to figure out what classes and/or modules and/or refinements define it, and which one to use in that particular location. It's a much more involved process than you'd think, especially with how Ruby handles constants and scope. In a lot of cases you can figure out what defines that method once and keep using the lookup that you did the first time - it's slow to re-run, so we don't.

There are two ways Ruby saves those lookups: the inline method cache, and the global method cache. After I explain what they are, we'll talk about the global method cache.

The inline method cache lives at a specific call site. It is "inline" in the sense that it's cached in your Ruby code where you call the method. That seems simple and sane. When it works, the global method cache doesn't get used - the lookup happens the first time the code is hit, and gets reused afterward.

The global method cache is for cases where that doesn't work - method_missing, respond_to? and refinements are examples. In those cases, it's very unlikely that the same place in your code will always get the same answer for "what is the method here?" Here's how Pat Shaughnessy puts it:

Depending on the number of superclasses in the chain, method lookup can be time consuming. To alleviate this, Ruby caches the result of a lookup for later use. It records which class or module implemented the method that your code called in two caches: a global method cache and an inline method cache.

Ruby uses the global method cache to save a mapping between the receiver and implementer classes.

The global method cache allows Ruby to skip the method lookup process the next time your code calls a method listed in the first column of the global cache. After your code has called Fixnum#times once, Ruby knows that it can execute the Integer#times method, regardless of from where in your program you call times .
— Pat Shaughnessy, Ruby Under a Microscope

There are a fixed number of entries in the global method cache - by default, 2048 of them. A Shopify engineer finds that gives a 90%+ hit rate even for a really huge Rails app, so that's not bad.

You can set the number of entries, but only to a power of two, with the environment variable RUBY_GLOBAL_METHOD_CACHE_SIZE. The default is 2048, so you'll normally want to go up from there, not down. Each cache entry is 40 bytes. So the default cache uses about 80kb, and each time you double the number of entries, you double the size. So Shopify's setting of 128k entries at 40 bytes/entry would use about 2.5 megabytes of memory.

How's the Speed?

I write and maintain Rails Ruby Bench, a highly-concurrent Ruby benchmark based on Discourse, a large real-world Rails application. I do a lot of checking Ruby and Rails speed using it. And today I'll do that with Ruby's global method cache.

Discourse isn't as huge as Shopify's Rails app - few Rails apps are. Which means it may not need to increase the cache size as badly. But it certainly has far more possible cache entries than the default 2048. So it's a pretty good indicator of how much a mid-size Rails app benefits from the cache size increase.

Long-time readers will be expecting a pretty graph here, and I have bad news for them: the difference in speed when adjusting the cache size is so small that any reasonable way to graph it makes it look like they're identical - which they nearly are. Here are the results as a table:

RUBY_GLOBAL_METHOD_CACHE_SIZEMean req/secStd deviationSpeedup vs Default
1024155.31.7-1%
2048156.81.50%
4096158.32.31%
8192159.53.21.7%
16384160.33.42.2%

So as you can see, my smaller number of cached entries are... Hm. If I check that Shopify article... They actually only claimed to get about 3% faster results. So my own results are directly in line with theirs. I see a tiny speedup, in return for a very small amount of memory.

So... Is It a Good Idea?

I don't see any harm in using this. But for most users, I don't think a savings of 2%-3% is worth bothering about. And that's assuming your Rails app is fairly large. I would expect a smaller app, or a non-Rails app, to gain very little or even nothing at all.

In most cases, I think Ruby's global method cache does a great job and doesn't require adjustment.

But now you know how to check!


Finding the right engineers for the job

IMG_9036 (1).jpg

The best engineers

"This project will be critical to our success. Let’s get our best software engineers on it…" Maybe you’ve heard something like this where you work. The question naturally arises, who are your “best” engineers?

When I first started my career, I believed that the best software engineer was one who rigorously applied the principles of good software engineering (SOLID) in a steady fashion to create something new. My thinking on this has shifted a bit. While I still very much believe in these principles, I now see them as a part of a larger picture.

The right engineers

A few years ago I attended a conference where I heard a talk from a company called CorgiBytes. They work as consultants specializing in improving and maintaining legacy code. To many software engineers, this would be the worst job imaginable. But the founders recognized that there is a special type of engineer who enjoys and even thrives on this kind of (often desperately needed) work. So they target hiring engineers with this specific strength.

CorgiBytes describes their members as, "the joyful janitors of your codebase." This quote is heartwarming to me. It reminds me that for every need, there exists a person who not only can do the job, but will derive their greatest satisfaction from doing it. What a wonderfully merciful thing that there is someone out there who will joyfully do the very thing you cannot stand doing.

True greatness, then, exists wherever a need meets a person perfectly suited to fulfill it.

The developer landscape

Okay, so if there are software engineers wired for legacy code projects, what other types of software engineers might exist? In his conference talk, the founder of CorgiBytes discussed the following model which he dubs the "developer landscape:"

chart1.jpg

Each quadrant in the model defines a particular type of developer. In the upper left hand corner you have your hacker-maker. This engineer is more concerned with "building the right thing" rather than "building the thing right." This person loves to crank out prototypes, experiment, and fail fast. In the upper right hand corner you have the craftsman-maker. This is your engineer who is more concerned with "building the thing right," rather than "building the right thing." This person wants to steadily apply the principles of SOLID. At the start of my career, I viewed this quadrant as the one strength that defined a good software engineer.

Below the x-axis are the code menders. The lower right hand corner represents the craftsman-mender. This is the type of engineer that CorgiBytes selects for. These engineers love to gut a nasty piece of code and replace it with something clear and maintainable. Finally, you have the hacker-mender in the lower left hand corner. These are the firefighters of your system. When a service is exploding or customers are in trouble, they parachute in and save the day. They are motivated by driving to a resolution quickly.

All of these strengths are needed in the context of a company like AppFolio that develops and maintains software services because each strength maps to a phase in the software lifecycle. Nothing truly new happens without the rapid prototyper, your system is quickly crippled by technical debt without your SOLID engineer, your codebase becomes legacy without your remodeler, and your services stop running without your firefighter.

Finding the right fit

In my first software engineering job, I worked in a context where the needs were almost solely SOLID and remodeler strengths. I enjoyed this work and I learned much. But I was unaware of the rapid prototyper and firefighting quadrants. I didn’t know they existed.

Things changed for me when I joined AppFolio. AppFolio’s organizational structure and focus on generalist teams suddenly exposed me to the entire developer landscape. I quickly learned that my real strength shines in the hacker quadrants. I can be quite happy in the craftsman quadrants, but I feel most alive in my work when I’m operating as a hacker. I wish I had learned this about myself sooner!

There is amazing power in finding the right fit for an engineer based on their strengths. I’ve been involved in several projects where we stacked the deck with "the best engineers," only to see these projects stagnate. We were evaluating whether an engineer was "the best" separate from the need they were intended to fulfill. Once we began asking, "which is the right type of engineer for this project?" we saw that different strengths were needed. When we made changes accordingly, we saw those projects come to life and succeed beyond what we even imagined.

Where do you fit?

What about you? Are you a great software engineer? As I said above, we have many opportunities at AppFolio for all of the developer types, as well as opportunities for developers who want to gain experience in new areas. Our organizational structure lends itself to exploration, and our journey as a company into new business verticals guarantees new adventures for many years to come. Come join us!

Ruby Memory Environment Variables - Simpler Than They Look.

You've probably seen some of the great posts on how you can use environment variables to tune Ruby's memory use. They look complicated, don't they? If you need to squeeze out every last ounce of performance, they can be useful. But mostly, they give a single, simple advantage:

Quicker startup time. More specifically, quicker time-to-full-speed.

You can configure your Ruby process with more memory slots or looser malloc/oldmalloc limits. If you don't, your process will still grow to the right size if it needs it. The only reason to set the limits manually is if you want your process to grow to full size and speed a little more quickly. If you're running a big batch job or a long-running server, the environment settings won't matter much after the first hour or so, and only a little after the first few minutes - your process will figure it out quickly in any case.

Why the speed difference? Mostly because when Ruby is still figuring out the right size for your process's memory, it has to garbage-collect a little more often. That slows things down until it hits its stride.

There are also some environment variables that set how fast to expand. Which, again, basically just affects the time to full speed -- unless you mess them up :-)

But I Really Want...

But what if you do want to set them for some reason? How do you know what to set them to?

I find that Ruby does a fantastic job of figuring that out, but it may take some time to do it. So why not use your same settings from last run?

That's what EnvMem does.

You run your process, dump the current settings (via GC.stat) and then use them for the next run.

There's hardly any reason to use a dedicated tool, though - if you look at how EnvMem works, it only loads a few entries from GC.stat into the corresponding environment variables. The tool is just executable documentation of which GC.stat entries correspond to which environment variables.

The three variables that it sets -- RUBY_GC_HEAP_INIT_SLOTS, RUBY_GC_MALLOC_LIMIT and RUBY_GC_OLDMALLOC_LIMIT -- are the ones that get your process to the right initial size. And doing it based on your previous run is better than any other method I know.

For most applications, let them run for a minute or two until the settings are automatically set correctly. If your application doesn't run that long, then congratulations - these aren't things you need to worry about. If you need fast startup time, use EnvMem. Or just do the same thing yourself, since it's easy.

But What About...?

This all sounds reasonable, sure. But what about those last few variables? What about the ones that EnvMem doesn't bother to set?

You can tune those, sure. Keep in mind that if you tune process size, then you should not tune the other variables exactly like you would for a new process.

Specifically: for a new process, you want to make sure expansion is fast and happens in big chunks, so that you have a nice low startup time. For a process that is old and carefully tuned, you want to make sure expansion is slow and happens a little at a time so that you don't waste too much memory.

Ruby has several "max" variables to prevent adding too much of anything at once. That can be disastrous if they're set too low - it means expansion happens very slowly, so full speed only happens after the process has been running for many minutes. But for a mature, well-tuned application, good "max" values can prevent bloating by allocating too much of a resource at one time.

So with that in mind, here are the last few variables you might choose to tune:

  • RUBY_GC_HEAP_FREE_SLOTS_GOAL_RATIO: for a fast-growing app you might set this low, around 0.3 to 0.6, to make sure you have lots of free slots. For a mature app, set it much higher, even up to 0.8, to make sure you're not wasting much memory on unused slots. Keep in mind that you need free slots for new objects in new requests, so this should basically never be higher than 0.95, and rarely higher than 0.8.
  • RUBY_GC_HEAP_GROWTH_MAX_SLOTS: this is the cap on how many new slots can be added at once. I find the defaults work great for me here. But if you're actually counting slots allocated on new requests (via GC.stat) it may make sense for you to limit the number of maximum slots allocated. If you aren't counting slots with GC.stat, please don't set this manually. Don't optimize before you profile.
  • RUBY_GC_MALLOC_LIMIT_MAX: this determines the fastest rate you can raise RUBY_GC_MALLOC_LIMIT, which in turn determines how often to do a major GC (one that checks the old-generation objects, not just new.) If you're using GC.stat and watching the malloc_increase_bytes_limit, this determines how fast to raise that (at most.) Until everything in this paragraph sounds straightforward, please don't customize this.
  • RUBY_GC_OLDMALLOC_LIMIT_MAX: this is like RUBY_GC_MALLOC_LIMIT_MAX, but it affects the oldmalloc limit instead of the malloc limit. That is, it affects how often you get major GCs in response to the old generation increasing in (estimated) size. Again, if this all sounds like Greek to you the you're happiest with the default settings - which are pretty good.

Happy Tuning! Better Yet, Happy Not-Tuning!

So then, what's the upshot? If you're just skipping down this far, my recommended upshot would  be: Ruby mostly tunes its memory configuration wonderfully, and you should enjoy that and move on. The environment variables don't make a difference in the long-term runtime of your application, and you don't care about the (tiny) difference in startup/warmup time.

But let's pretend you're looking for even more detail about tuning and how/why the Ruby memory system works the way it does. May I recommend the slides from my RubyKaigi presentation? Don't skip the presenter notes, most of the interesting details are there.


Upgrading Rails 4 Controller Tests to Rails 5

At AppFolio, we're finally in the process of upgrading many of our Rails applications from Rails 4.2, up to Rails 5.2. Our first, and biggest step is to upgrade to Rails 5.0. While there are many parts necessary to complete this upgrade, I would like to share a few things we have done specifically to address the backwards incompatibility Rails 5 introduced in controller tests.

In case you aren't aware, it was common in Rails 4 to write controller test request methods in the following syntax:

get image_path, id: '12'

In addition to providing a params hash, perhaps you wanted to include something in the request's session, and pre-set a flash message as well. That can be accomplished via:

get image_path, { id: '12' }, { user_id: '39' },
    { success: 'page successfully created' }

Note that the first hash corresponds to params, the second hash session variables, and the third, flash values as indicated in the Rails 4.2 testing tutorial.

In addition to the get method, the test request methods, delete, head, patch, post, and put also existed in Rails 4.2. Finally, if you wanted to mimic an asynchronous request, one would instead use the xhr method, which aside from the first argument to indicate the HTTP verb, has the same method signature as the previously listed test request methods [ref]. An xhr method call might look like the following:

xhr :post, image_path, { title: 'New Image' }, { user_id: '39' }

In Rails 5, two things have changed: first, passing params, session, and flash by positional argument are no longer supported, and second, the xhr method no longer exists; it is replaced by adding an xhr: true keyword argument to one of the test request methods. Keyword arguments are awesome, and were introduced in Ruby 2.0, with required keyword arguments being introduced in Ruby 2.1 [ref].

The three prior test examples should be written for Rails 5 as follows:

get image_path, params: { id: '12' }

get image_path, flash: { success: 'page successfully created' },
    params: { id: '12' }, session: { user_id: '39' }

Note that in the above the order of the keyword arguments is irrelevant; I like to keep mine sorted.

post image_path, params: { title: 'New Image' }, session: { user_id: '39' }, xhr: true

Making any individual change from the Rails 4 syntax to that of Rails 5 is pretty trivial, however, it can be incredibly tedious and error prone when there are thousands of such invocations. To support this part of our upgrade to Rails 5, we have written two open source tools, and utilized another well known open source tool, Rubocop.

First, we wanted a way to support the Rails 5 syntax in Rails 4. Doing so would enable us to stop writing tests the old way, and instead write tests the new way. Additionally, once we've upgraded part of our application to use the new syntax, we wanted to enforce using only the new syntax in that part of the application so we didn't have to repeat the update process multiple times until we finally switched a project to depend on Rails 5. These two objectives were met through the introduction of our open source rails-forward_compatible_controller_tests gem.

This gem provides the ability for a Rails 4 application to use keyword arguments with the test request methods, as well as use the xhr: true keyword argument. Furthermore, this gem can be configured to do nothing, output DeprecationWarnings, or raise an exception when using the old syntax. The DeprecationWarning configuration is perfect while in transition, and raising exceptions is useful both while making a complete transition to the Rails 5 syntax, and afterward to ensure no regressions are introduced.

With the rails-forward_compatible_controller_tests gem in place, all that was left was to convert the thousands of Rails 4 test request method instances in our codebase. Fortunately, one tool was already available to aid in this effort. That tool is rubocop; more specifically rubocop used in combination with its Rails/HttpPositionalArguments cop.

By running the following, rubocop will autocorrect most uses of test request methods, except for uses of the xhr method:

rubocop -a --only Rails/HttpPositionalArguments

To support automatically fixing those xhr instances, we wrote and open sourced another gem, rails5_xhr_update. One way to utilize this gem is by looking for all files containing "xhr :" and passing those files to the rails5_xhr_update program with the --write option set to indicate overwriting the existing files like so:

git grep -l "xhr :" | rails5_xhr_update --write

By following the aforementioned steps we've made significant progress towards our Rails 5 upgrade. Of course, there is still a lot of work to do, and Rails 6 is on the horizon. If you’re interested in helping continue to support future versions of Rails while delivering exceptional value to our customers please see http://www.appfolioinc.com/jobs.
 

To Sleep, Perchance to Dream: Rails Ruby Bench and Sleepy GC

Hey, folks! It's been a few weeks since my last post about Rails Ruby Bench, so let's talk about some things you don't see it do, but it does behind the scenes! We'll also talk about an interesting new performance change that may be coming to Ruby 2.6.

That change is Eric Wong's Sleepy GC bug report and patch. With SleepyGC, Ruby will garbage collect with spare (idle) cycles. If you're just here for the latest Ruby development news, skip this post and click the bug report. Original sources are always more compete than commentary, right?

(Want to skip the narrative and go straight to the upshot? Skip to the bottom -- look for "So Did It Work?")

A Little Story

A few days ago, the excellent Sam Saffron of the Discourse team asked for my opinion on a pending Ruby speed patch. Yay! Rails Ruby Bench exists for this exact purpose: when a new Ruby patch comes out, I check how much it speeds up Rails (or slows it down.) And then you all know!

Of course, just lately I've been working on scaling out the benchmark itself, as my Ruby coordinator post suggests - right now, even if Discourse scales up just fine, my benchmark tops out at an EC2 m4.2xlarge instance. Above that I'm not configuring enough connections to Postgres, so I can't run enough threads and processes to use all that capacity. Working on it!

As a result, I haven't been constantly running RRB on the latest head of Ruby, because I've been working on other stuff. Which means my results are a bit out of date. Ruby also keeps getting faster, and the speedups keep getting smaller. This should make sense -- you've seen my "look, faster Ruby!" numbers, and it keeps getting harder to get large speedups after the last few hundred large speedups. Which means I need to crank up the number of requests per run and the number of runs per batch to keep pace. The Ruby core team are good at what they do! At the moment my "quick, rough check" numbers are 10,000 HTTP requests per run and 30 runs per batch (that's 200k HTTP requests) for reference, and that doesn't catch really small differences! And that still gets occasional outlier runs, so that's definitely not enough to check, "hey, does this sometimes cause random slowdowns?"

When I checked, things were a little broken. There was a slight speed regression for late March and early April Rubies, and a slightly older version (around May 1st) wouldn't run Rails Ruby Bench at all - the requests just didn't return.

So here's a "thanks for reading" takeaway for you -- don't run your production infrastructure on untested, non-release Rubies from random dates in the repository. ;-)

But here's another: the speed regression didn't last. Even when they're mostly testing on non-Rails code, mostly the Ruby core team do a great job keeping everything in a good shape - small problems tend to be caught and found rapidly, even in the long gaps between releases and previews.

Eventually I found a working Ruby, got a nice stable Rails Ruby Bench performance baseline just before the Sleepy GC patch, and ran a big batch of tests on Ruby 2.6.0 preview 1, the Ruby right before Sleepy GC, and Sleepy GC version 3 from Eric Wong's repository.

Wait, What's Sleepy GC?

Normally Garbage Collection (GC) runs when you've allocated a lot of memory, or when your process is running low and needs more. In other words, normally you reclaim old unused memory when you need memory -- and not before. You can manually run garbage collection before that in most languages (including Ruby) but that's not especially common.

It can be hard -- or impossible -- to avoid random pauses in your program if you use garbage collection. That's one reason that GC tuning is such a big deal in the JVM, for instance. Random pauses aren't necessarily a problem for every workload, but ask a game programmer about GC some time and you'll see what's wrong with them!

Ruby normally has "idle" times, such as when it's waiting for a file to be read, or network packets to arrive, or a database query. There can also be idleness from explicit sleeps or delays if the Ruby process is trying not to use more CPU than necessary. In all of these cases, it may make sense for the garbage collector to do some of its work in the idle time rather than making your program wait when you need memory.

Of course, if your Ruby process has lots of threads then you may already be filling this idle time with other work.

So Did It Work?

The short version is: the current Sleepy GC doesn't do anything for Rails Ruby Bench. If you think for a second, this should make sense - RRB runs a giant concurrent workload flat-out from startup until shutdown, overloaded with threads so that every CPU is running Ruby code constantly. There are no unfilled idle cycles. So Sleepy GC neither speeds up nor slows down RRB detectably -- which is a win, if it speeds up other workloads. Sam Saffron suggests it may do well for Unicorn servers, for instance. That makes sense - Unicorn runs one thread per process, so it may have lots more idle time than a heavily-multithreaded Puma workload like RRB. Sleepy GC may be useful, but RRB is a terrible way to find out one way or the other. That's fine. No benchmark shows you everything you care about, and it's important to know which is which.

While from my viewpoint, it was a great success! I have determined to my own satisfaction that there aren't lots of idle cycles for GC that I'm not capturing, so RRB did what it should have!

If you have a workload that you think may benefit from Sleepy GC, you can also try it out yourself. Sam Saffron says it helps certain Postgres workloads quite a lot, for instance. As of this writing, the latest branch is "git://80x24.org/ruby.git" on branch "sleepy-gc-v3". But read the bug report for the latest, always.

Ruby and Haskell: Culture is What You Don't Say

I'm working through a Haskell book with some friends. Learning something new is always good! But it's also because I write and teach Ruby. Learning from other communities helps me notice the cultural differences between, say, Haskell and Ruby.

I'm working with the excellent book "Haskell Programming from First Principles." It's far and away the best Haskell instruction I've found so far. It's easy to look at weirdness in bad instruction and say, "oh, this just isn't very good." But when you see things that seem weird in a first-class book like this, you're usually looking at a cultural difference.

Am I trashing Haskell? Or Haskell culture? Oh, heck no. I am really glad there are purists out there doing their thing. I'm thrilled to be learning from them. I'm very impressed with this Haskell book. Explaining unusual new concepts is hard.

But let's look at some differences between their culture and Ruby culture, shall we?

Judging Haskell by Its Cover

Our intrepid authors acknowledge that Haskell is known for being hard. To quote them:

There’s a wild rumor that goes around the internet from time to time about needing a Ph.D. in mathematics and an understanding of monads just to write “hello, world” in Haskell.
— Haskell Programming from First Principles (Allen and Moronuki)

Here's what's interesting about that: their entire first chapter is explaining the Lambda Calculus, before even talking about how to install the Haskell environment. Not just conceptual explanation, but in-depth math with work-it-out-for-yourself math exercises. They also say they strongly recommend not skipping it, and that (much) later chapters will make more sense if you know the math. They know that the math is intimidating to beginners. They respond by jumping very far into it, very rapidly.

Is that wrong? I don't think so. It's a very un-Ruby-ish cultural choice. Which is fine for a Haskell book, right? If you see something unfamiliar, mostly you need to not be intimidated by it in Haskell. If you need it spoon-fed, you're probably in the wrong place.

Ruby tries really hard to have a gentle learning curve. It doesn't always succeed, but it tries very hard, to the point of rewriting all sorts of things in Ruby, documenting and testing to a fault, and generally beckoning folks in with "look how familiar this looks!" It's not that one way or another is better. The Haskell method will give you a fearless community with a "ho-hum" attitude to code that looks scary. If that bugs you, the door is that-a-way. The Ruby method gives you a lot of beginners (yay!) who sometimes need and expect more hand-holding. We like our way, but I can't really say what we do is right and what they do is wrong. I can say that you wind up with very different groups as a result.

This is by far the simplest, most approachable guide to Haskell I have ever seen. They try really hard to not require lots of up-front math, compared to nearly anything else. One of the authors learned programming more-or-less for this book. And they still open with the lambda calculus before "here's how you install Haskell" or any code whatsoever. The entire current Haskell community has learned from this or from much less friendly sources.

Speaking in Math

Haskell is well-known as pretty math-heavy. That makes sense. Even in a book that is very intentionally not as "all math all the time," here's an example description from chapter 2:

When we talk about evaluating an expression, we’re talking about reducing the terms until the expression reaches its simplest form. Once a term has reached its simplest form, we say that it is irreducible or finished evaluating. Usually, we call this a value. Haskell uses a nonstrict evaluation (sometimes called “lazy evaluation”) strategy which defers evaluation of terms until they’re forced by other terms referring to them.

Values are irreducible, but applications of functions to arguments are reducible. Reducing an expression means evaluating the terms until you’re left with a value. As in the lambda calculus, application is evaluation: applying a function to an argument allows evaluation or reduction.
— Haskell Programming from First Principles

That doesn't exactly require you to already know the math. But I feel very confident saying that if you find math intimidating, you will find that explanation intimidating as well.

This is, again, a major departure from how the Ruby community does it. In other words, it's another way in which their community is intentionally different. This is another case of, "we're going to explain it simply, plainly and in our own vocabulary, which often happens to be the same as mathematical vocabulary. If you're not already with us, we hope you'll catch up later."

Later in chapter 2, they say, "your intuitions about precedence, associativity, and parenthesization from math classes will generally hold in Haskell." So when they talk (sincerely!) about how you don't have to know that much math, understand that they're talking to an audience for whom the phrase "your intuitions [...] from math classes" is reasonable and unremarkable.

So... Haskell Unreasonably Assumes You Already Know Everything?

You might reasonably and fairly ask me at this point, "are you saying that Ruby is easier and better at explaining everything, then?" Not so much. Ruby has a different set of unspoken assumptions.

For instance, Haskell From First Principles takes its sweet time explaining modular arithmetic, much more so than you'd expect from the rest of the book. It goes into detailed examples and hits a lot of corner cases explicitly in a way it doesn't for other operations. Modular arithmetic is certainly no harder than several things it skims over. Instead, modular arithmetic is less immediately familiar to most mathematicians than to programmers. A Ruby guide wouldn't usually call it out in such detail because historically, most Ruby programmers come from a language like C or Java that already has modulus built in, most frequently as the percent-sign operator.

In fact, the famous old free version of the Pickaxe Book for Ruby spends a lot of time waxing poetic about how Ruby has the excellence of two or three programming languages you presumably know (Perl, Python) plus one or two you mostly know by reputation (SmallTalk.) It isn't that Ruby makes no assumptions! Ruby's also okay with some quirkiness - have a look at Why's Poignant Guide to Ruby for an extreme-but-popular example.

I Didn't Say That! Though I'm Incomprehensible If You Don't Assume It.

One of the fastest ways to identify your culture is what you don't say. Haskell is fine if you're coming from math but don't know the "standard" C-descended-language idea of modulus, but very hard if you're not used to fairly abstract algebra. Ruby tutorials usually assume you've programmed in C or one of its descendants. They "know" you probably feel a little funky about Functional Programming and you probably don't have a math degree (even if you do -- I do!)

Neither one says this up front. They just say a lot of other things that casually assume them. If this "resonates" with you, it mostly means you're a match for their assumptions. Congratulations! It's always nice to find a community you fit in with. If it doesn't resonate with you, I have confidence you'll keep looking around until you find something that does. You seem resourceful that way.

Again, unstated assumptions aren't wrong. If you tried to state absolutely everything, you'd get another culture still, also with unstated assumptions (e.g. "we claim we have no unstated assumptions by virtue of cataloguing the obvious at great length - please pretend that completeness is possible in this universe.") Culture happens in the assumptions and what goes unsaid.

And the current cultures are neither right nor wrong. There may be some alternate Ruby universe where the founding Rubyists assume we all have math degrees, but we don't live in that one. Haskell could have come from a different group and speak in chemistry or biology analogies, but that's not where our world's Haskell community came from.

Can You Finish With a Moral Please?

It would be easy to tie this up with something smug on one side or the other. Nobody avoids having a preference about cultures, you know? It's easy to glibly say "Ruby is better because it's friendlier to novices" or "Haskell is better because it keeps the bar higher."

Try this as a moral, instead: don't just read and see if you get a good or a bad feeling. Listen to what gets said that makes you feel that way. Then, think about who it attracts or repels. Because culture isn't just in "learn this language!" books. It's in every part of the programming community - blog posts, Twitter, forums, talking in person.

Ruby has a very strong culture. If you're reading this, you're likely a part of it. There are problems coming, and storms to weather -- always, and as there always have been.

Don't just drink the culture around you. Learn to see it consciously, and learn to make it for yourself. Our local culture can use your help, and every culture needs more people who can see it consciously.

Ruby Coordinator Processes for Fork Servers

Often I think, "threads are really annoying. Why don't people use processes?" Then, I use processes. Usually as I'm thinking, "processes are really annoying. Why don't I use threads?" The joke's on me either way, of course.

Until Guilds happen, those are mostly our options, outside special cases that can use EventMachine or Fibers or actors or whatever. I tend to consider processes to be the lesser evil for general use. And by "general use" I mean "not on Windows."

But cleaning up processes can be ugly. Oh, man. If you don't catch all your dead children you get zombie processes. And that's not even the most gruesome mixed metaphor in Unix concurrency.

So: let's look at a pattern in Ruby for using a single coordinator process with a separate process group to wrangle the child processes. Consider this a sort of extended fork/pipe example for spawning child workers, showing one way to set everything up. It's a somewhat advanced pattern. Don't be dismayed if you have to reread this or play with the code a bit before you get it right.

I write Rails Ruby Bench. It's a sort of HTTP load tester. So that's the example I'm using. If I talk about passing around URLs and timings, that's why.

Ruby Fork and Pipes

With a little Googling, you can find an example of creating a child process in Ruby and opening a pipe between the two processes. It'll look something like this:

pipe_out, pipe_in = IO.pipe

pid = fork do
  pipe_out.close # For parent's use, not child's use

  output = do_something()
  pipe_in.write(output)
end

pipe_in.close
result = pipe_out.read
pipe_out.close  # Done with it now
Process.waitpid(pid) # Wait for the child's death and cleanup

So, okay. That's maybe a tad confusing, but not too bad. For those of you who don't write command shells in Unix all day, the call to fork is copying your Ruby process into two nearly-identical ones. There's a new process (called the "child") that will now only run the code inside that block, and your first process (called the "parent") will ignore the block and carry on as though the fork method didn't do anything. The "pid" above stands for "Process ID", and it's a big number like 32741. It's used to identify the process. You've probably seen them before in "ps" or "top" output or the Mac Activity Monitor.

The IO.pipe method returns two IO objects. If you write to one, the other can read it. We'll pass one into the child and keep one in the parent. Well, okay -- actually, we copied both sides of the pipe when we copied our process. So we'll close one side in the child, and close the other side in the parent.

The child does some work ("do_something" above) and then passes the result, as a string, through the pipe. The parent reads the result from the pipe. If necessary it will hang out doing nothing on that "read" for as long as necessary, or until the child dies.

You need the pipe because the two processes are completely separate. So you can't just assign a returned value in the child and have it show up in the parent. That's why we write in the child and read in the parent. It's also why we don't need to use a Mutex like we would with threads - the two processes are more separate than that, so they use a pipe instead.

The final Process.waitpid is telling your operating system, "when that child is finished, I'm done with it. You don't need to save me any more pipe output or whether the child succeeded or failed or anything. I'm all finished with that child process, you can clean it up." You can also call it without a process ID as the argument and it will just wait for any child to die.

That's not a coordinator. But it's the building block we'll be using to make one.

Mo Processes Mo Problems...

If you want many processes to each do work, you can do the above many times. That's the same basic principle behind app servers like Unicorn, or Puma's cluster mode, for instance. The traditional Unix "fork server" is exactly that. Normally you call the original process the "master" and the forked child processes "workers".

One difficulty of all this is cleanup. Normally a master process only manages the workers, because failures are hard. If you want to do other things in your master process (like Rails Ruby Bench does,) you'll want a coordinator process. Then the master process can calculate and handle input, the coordinator process can watch for dead children, and of course the children (a.k.a. "workers") will do the work. But you still have to keep track of everything to clean it up.

Unix and MacOS have a great tracking mechanism for watching and cleaning this stuff up: process groups. You may have used them before without knowing it. You know how if a process gets way out of hand you can use "kill -9" to kill it? The "9" part means the unblockable, uncatchable SIGKILL signal. Did you ever wonder what the minus is for?

It turns out the minus means "don't just kill this one process. Kill everything in its process group." A process group, by default, includes any other processes it forks off, so it cleans everything up, including all the child processes. This is magic that you, too, can use.

In other words: the top-level "master" process forks a coordinator. The coordinator sets up a new process group, then forks some (or many!) workers. When the task is done, terminate the coordinator's whole process group with extreme prejudice. Now you can be sure: it's all cleaned up.

Here's one way that can look:

def manage_workers(num_processes, &block)
  processes = []
  pipes = []
  num_processes.times do
    pipe_out, pipe_in = IO.pipe

    # Inside each process, run the block, print the result and exit.
    started_pid = fork do
      pipe_out.close
      val = yield
      pipe_in.write(JSON.dump val)
    end
    pipe_in.close
    processes.push(started_pid)
    pipes.push(pipe_out)
  end

  result = []
  pipes.each do |pipe|
    out = pipe.read # Or read in a loop until it returns ""
    result.concat JSON.parse(out)
    pipe.close
  end

  # Wait for all child pids
  until processes.empty?
    dead_pid = Process.waitpid(0)
    processes -= [ dead_pid ]
  end

  result
end

def run_coordinator(num_processes, &block)
  coordinator_out, coordinator_in = IO.pipe

  coordinator_pid = fork do
    coordinator_out.close
    pgid = Process.pid  # Get child's own pid
    Process.setpgid(pgid, pgid)  # Detach into new process group

    combined_output = manage_workers(num_processes, &block)
    coordinator_pipe_in.write(JSON.dump combined_output)
  end

  coordinator_pipe_in.close # For coordinator use, not parent use
  json_result = read_all_from_pipe coordinator_pipe_out
  return JSON.parse(json_result)
end

Is this a new idea? Kind of. It's not frequently done in exactly this way. But a very common method is to run a command that has a master process (e.g. Unicorn, Passenger, Puma in cluster mode) from your process. You're certainly allowed to kill off Unicorn or Puma with a "kill -9" if you want to. But you normally run the command with system or backticks, which fork-and-exec. The coordinator process is effectively moving that fork-and-exec into your own Ruby code.

(Rails Ruby Bench does both - it runs the load testers with this coordinator-based method. It runs the tested Rails server with Puma.)

Awesome! Now When Do We Do This?

Any useful pattern, library or data structure has a most important question attached: when do we use it, and when don't we?

The Coordinator pattern is needed when you want/need multiple child processes working on the same problem, but you also have work that belongs in a master process, at the top level. By separating worker management from the master-process calculation, you can make cleanup easier and separate the logic better.

When do you not use it? When you don't use multiple processes -- such as a single-process calculation, or something you do with threads, actors or events instead of worker processes. You also wouldn't use it if you just need to coordinate workers without doing top-level work -- then your coordinator is your master process, as though you were writing a fork server like Unicorn. And finally, you wouldn't use it if somebody has written a worker-coordinator process for you separately, like if you want to run a multiprocess HTTP server. In that case, just fork-and-exec their version, which replaces the coordinator. You can also set it up in its own process group if you like, using normal Unix methods.

Programming in Paradise

January sunrise over the Pacific Ocean in Santa Barbara, CA (2018)

January sunrise over the Pacific Ocean in Santa Barbara, CA (2018)

Once a month, I wake up very early, put on a warm jacket, make myself a cup of coffee, and sneak out of the house while the rest of my family is still asleep. I drive about ten minutes up highway 101, past hills, a vineyard, lemon orchards, and a couple of ranches, to a turnout on the side of the road where I can park the car. There is a short path I walk along to a cliff with a great view. I stand at the edge drinking coffee while I watch the sunrise over the Pacific Ocean.

Santa Barbara is a unique place where, because of its location and orientation on a coastal point, the sun both rises and sets over the ocean for half of the year. Sometimes I can watch the sun sink back into the ocean from a hill near my house after I leave work and before I return home to the tornado of energy that is life with three small children.

This is a blog post about software engineering in Santa Barbara (or programming in paradise, as some call it). I’m writing it as a reflection on my time here, because I think our environment has a big impact on how we see life and on the work that we do. Even a company like Apple recognizes this -- they proclaim, “designed by Apple in California,” on the packaging for their products.

I grew up in Los Angeles and decided to attend the University of California Santa Barbara after high school. I knew even in high school that my passion was coding. I figured, “what could be better than studying what I love in a beautiful city?” It was not long before I fell in love with this place. I had an ocean view all four years of my undergraduate studies. When I finished school, I decided I had found the place I wanted to call home and would find work at one of the tech companies built upon the engineering talent which UCSB attracts to the area.

Santa Barbara has a different feel from what you might think of as a beach city. Just a couple miles inland stand the impressive Santa Ynez mountains. These mountains offer hiking trails, waterfalls, and hot springs for people to explore. Santa Barbara is sandwiched between this tall mountain range and the ocean. The unique topography of the area creates a temperate Mediterranean climate unique to coastal California. The climate is well suited for vineyards, lemon orchards, and avocado orchards, all of which you can find throughout the city.

The city has a small town feel (despite the fact that it is 20 miles long). There is a high likelihood I will see someone I know whenever I visit the grocery store or a restaurant, and for me this leads to a strong feeling of connectedness with the community. This feeling of connectedness is even stronger within AppFolio, where the people I work with are the same people I love spending time with outside of work too. This is a different experience than what I had growing up in a big city like Los Angeles.

I think the connectedness we experience and foster within AppFolio because of our location in Santa Barbara has a profound impact on our business and in the lives of our customers. More than anything, we are a customer driven company. Everything we do is based on input and feedback from customers. We do this by connecting with them and with one another. We are constantly creating prototypes and putting them in front of customers to get feedback, we invite customers to our office, we send teams to visit customer offices, and we attend customer meet ups all over the country. I’ve even had a customer invite me and a team over to his house for BBQ and prototyping.

Just a couple weeks ago I traveled to Seattle with a team of engineers. We rented a big AirBnb together and hacked on code in the offices of two customers. We built a prototype in one office, and completed a shippable feature in another office in just four hours. To me there is nothing as satisfying as seeing the smile on a customer’s face because of something we created together.

Many of our customers are small, family operated businesses. When we work closely with them, I feel it is our family connecting with theirs. They trust us because we listen to them and we are top notch engineers. We love them because they give us a reason to come to work each day. We are a growing company but we believe that part of our success depends on us “keeping it small” so that no customer or teammate gets lost as a cog in a big machine.

We are a group of passionate engineers. We work hard and get the job done. We take pride in our work as engineers, and we never want to let our teammates down. In my experience, the best engineers are the ones who realize that being brilliant will only get you halfway there. The other half depends on a willingness to roll up your sleeves and make things happen. These engineers love problems because they recognize them to be opportunities.

We work exceedingly hard, but we are not running in a rat race. Our location in Santa Barbara reminds us that there is more to life than work. Across our engineering group we have avid rock climbers, cyclists, runners, surfers, volleyball players, soccer players, softball players, hikers, and kite boarders. Santa Barbara is a place that attracts people from all over the world because of its natural beauty, the influence of the university, and its deep cultural roots. There are many festivals throughout the year, including Fiesta, the French festival, the lemon and avocado festivals, the solstice parade, and the famous Santa Barbara film festival. Visitors and residents enjoy a variety of unique restaurants throughout the city.

Santa Barbara has much to offer beyond work, but for those times you need something from the big city, a short drive to the south will take you to LA. We are far enough from LA that the air is free of smog and the highways are not a constant traffic jam, but we are close enough for a day visit. To the north you can enjoy wine country. People from all over the world come here to vacation and we get to live here!

Santa Barbara is a special place to me and to so many of us at AppFolio. This is the place I met my wife. I proposed to her standing on top of the mountains overlooking the city and ocean. I loved what Santa Barbara had to offer when I was a college student who had just moved away from home, and I love it now as a place where my wife and I can raise our three young boys. The beauty of the city and surrounding nature, the people I have come to love, and the opportunities I have to build something awesome with an amazing team are the things that keep me here.

We’ve got a thriving business at AppFolio and are hiring great engineers who want to have real impact in customers’ lives. If this is you, then come program with us in paradise!

November sunset over the Pacific Ocean in Santa Barbara, CA (2017)

November sunset over the Pacific Ocean in Santa Barbara, CA (2017)

Ruby 2.6 and Ahead-Of-Time Compilation

Ruby 2.6 preview 1 has optional JIT that you can turn on with a command-line switch. It also has a mode where you can tell it to wait for JIT before running your code, which is marked as a "test" option. But can you just turn it on and get Ruby AoT for our Rails Apps?

Let's check!

I maintain Rails Ruby Bench, so that's what I'll be playing with here, but the JIT and AOT advice should apply to most large Ruby apps. Also, keep in mind that JIT has only just happened and it's not recommended for Rails apps yet - you should expect things to change a lot after April 2018, when this article was written.

How Can We Do It?

For current Ruby 2.6, you have to turn on JIT explicitly. I use this:

export RUBYOPT=--jit

But any way you set the command-line option is just fine.

Then you run your app. For longer-running, smaller-size apps, JIT should just magically make it faster. If that's what you were after - congratulations! You can skip the rest of this article and play Plants Vs Zombies. You have my permission, as long as it's the first one - the sequels aren't as good.

But I found that this slowed down Rails Ruby Bench instead of speeding it up, just like the preview announcement said it would. D'oh!

If you run "ruby --help" you'll see some new JIT-related options:

MJIT options (experimental):
  --jit-warnings  Enable printing MJIT warnings
  --jit-debug     Enable MJIT debugging (very slow)
  --jit-wait      Wait until JIT compilation is finished everytime (for testing)
  --jit-save-temps
                  Save MJIT temporary files in $TMP or /tmp (for testing)
  --jit-verbose=num
                  Print MJIT logs of level num or less to stderr (default: 0)
  --jit-max-cache=num
                  Max number of methods to be JIT-ed in a cache (default: 1000)
  --jit-min-calls=num
                  Number of calls to trigger JIT (for testing, default: 5)

Hey, "--jit-wait" looks like exactly what we're looking for. So then we turn it on and we have Ruby AoT compilation? Not quite.

If we run RRB with just "--jit --jit-wait", it will hang forever as far as I can tell.

It turns out the new JIT has a cache of compiled methods, and that cache has a maximum size. And a Rails app is generally too big for it, and Rails Ruby Bench is definitely, no question, way too big for it and it winds up basically hanging. But we can turn the size up with --jit-max-cache!

So we set it up like this:

export RUBYOPT='--jit --jit-wait --jit-max-cache=100000'

And then we run the benchmark. And we get our next indicator that something's wrong.

It doesn't hang, exactly. It just starts up veeeeeery slowly. Like, getting to the point where it would make an HTTP request takes multiple minutes. And then it fails, probably because Puma's HTTP delays aren't set up for HTTP requests taking that long.

A Little Bit About Ruby's New JIT

You may remember from some of the previous writing about Ruby's new JIT that it works in an unusual way. It writes out C source files to a temp directory, compiles them to shared libraries and then loads them in a bit like native extensions for gems. That's a perfectly good approach, and it doesn't cause any problems here.

Ruby waits to compile a method until it has called that method a few times. Sure. Takashi pointed out that it's better not to tell it to compile the method the very first time we hit it (which we aren't, but we could with --jit-min-calls above) because if we wait a bit, we'll get better invocation data so the final result will be faster. Okay, but that's still not the problem.

We have a background thread that sits and compiles methods, one at a time, in this way. This is closer to the problem we're seeing...

If we run Rails Ruby Bench and tell it to wait until we have compiled tens of thousands of methods, one at a time, in a single background thread that runs the C compiler for every individual method... Yeah, okay. That looks like the problem.

Just to add insult to injury, we're also loading a lot of stuff into that cache and it eventually gets big. But don't worry - you don't have enough patience to wait until it gets really huge. You were hoping to speed up your Rails app... And this isn't going to feel very fast to you. It adds minutes of time to startup, which causes enough race conditions that the resulting app won't run anyway.

So when the Ruby option said it was just for testing, it meant it.

I Just Skipped To The End - Does This Do AoT Or Not?

The short version is: there's not really an AoT compile option in Ruby 2.6. The JITting options simply don't do that in a useful or acceptable way. You're far better off using it in the recommended way.

And for now, the recommended way for Rails apps is: don't. But that's likely to change soon. The Ruby release (2.6) with JIT is still in preview. There's a lot of polishing-up to do yet.

Rails Ruby Bench: What Is It and Why Should You Care?

Recently the brilliant and accomplished Chris Seaton asked me what the difference was between Rails Ruby Bench and the normal Discourse benchmarks, as seen on ruby-bench.org.

Plus I keep writing about RRB and linking to the code on GitHub. That's not terrible, but it's not exactly friendly. So let's talk: what is Rails Ruby Bench? Why should you care?

(Spoiler: if you mostly care about Ruby on Rails performance on a big server or VM, Rails Ruby Bench is the closest to "your" benchmark for Ruby that you'll find.)

The Very Basics: What Is RRB?

Rails Ruby Bench uses Discourse, a real-world Ruby on Rails app, and a simulated realistic workload to benchmark the speed of Ruby. So: what is "real-world"? Let alone "simulated realistic workload?"

First off, if you have 40 minutes here's what I said about that at RubyKaigi in Hiroshima in 2017, along with a lot of the information about Ruby's speed that came from RRB. I'm pretty proud of it!

But for the quick version: Ruby benchmarks historically tend to be about the language's raw speed, and tend to be pretty small. OptCarrot is a great example - a very solid benchmark that still doesn't use Rails or concurrency or much garbage collection. A benchmark like that is really easy to work from and it has a lot to do with the language itself. That's exactly the kind of major benchmark you want if you're implementing a language. Which is why they did!

But when you're telling the community about your speedups, folks want to know: but what about lots of threads or processes? What about I/O-bound and memory-bound applications? And in Ruby they ask, "but what about Ruby on Rails?"

Those are great questions. RRB tries hard to answer them.

How Does It Do That?

Rails Ruby Bench uses a real-world, typical, in-production open-source Ruby on Rails app as its basis. That would be Discourse, software for forums built by a real commercial company. It has all the little hairy bits of DDOS-protection and security and stuff that Real Apps do and benchmarks usually do not. Then it generates a lot of repeatably-random but realistic HTTP requests browsing through topics, saving drafts, posting comments and so on. It mimics a lot of users doing their thing and determines how much load Discourse can process with that Ruby version, basically.

RRB uses a large dedicated EC2 instance and loads it up to full capacity, running flat-out. Then it measures how fast 10 processes and 60 threads can process the requests. This is a pretty realistic setup and looks a lot like how small-to-mid-size startups do it and what they care about.

It's a benchmark, so what does it do badly? It runs the load-test process and the database on the same instance as the benchmark - that's great for low-variance results (no network, no noisy neighbors) but is absolutely not a realistic setup. It also runs with only a single application server and no load balancer, so it tests nothing about the scaling of load-balancing or the database. That's because it's a benchmark for the Ruby language, and neither of those components normally use Ruby. Similarly, it runs without a reverse-proxy in front (no NGinX) and the load-tester doesn't request static files -- I want to test Ruby, not NGinX.

Other good things about RRB: its basic setup has been vetted by luminaries like Nate Berkopec, Richard Schneeman, the aforementioned Chris Seaton and others. I've changed a number of things to reflect their observations and/or my previous screwups. So it's battle-tested.

It's also shown some fairly interesting things about Ruby's speed. Again, I recommend my RubyKaigi 2017 presentation for even more details.

More for Pedants (Scroll Past If You Don't Care)

What about failed requests? If any request generates a 500-series error I throw away the whole run, normally between 4,000 and 6,000 requests, depending on what's being benchmarked. As Ruby gets faster and I measure smaller effects, the number of HTTP requests per run has to go up to get accurate results.

I most frequently run with one warmup start/stop iteration, and 100 warmup HTTP requests. If I use a different number than that, I'll say so in the specific post about it. It's configurable when you run RRB.

I've used multiple Discourse versions over time, and I update slowly over time. It's hard to keep RRB usable across many Discourse versions as the code and HTTP request format changes -- that's just a hazard of using a real-world app.

Why RRB Is Different

The standard Discourse benchmarks request the same URL many times in a row using ApacheBench, then measures the speed with a simple "best time out of N" metric -- though it also does one run where it measures the memory usage. RRB requests different URLs in different orders with different parameters, which affects the speed of the resulting benchmark and gives a "blended" result from many different URLs. As a result, you'll often see Ruby optimizations where different standard Discourse benchmarks give different amounts of optimization and RRB shows a weighted average of those speedups - sometimes a particular Ruby optimization is much faster for some URLs than others.

Smaller benchmarks like OptCarrot often give very different results than RRB. They tend to measure CPU time, while RRB effectively measures memory and I/O performance as much or more -- it's a bunch of parallel Ruby on Rails processes running in Puma, so CPU time isn't the be-all end-all that you see in a much smaller process.

RRB's primary difference from straight-up I/O or garbage collection benchmarks is that it does measure CPU performance. You might expect Ruby on Rails to not care about CPU performance, and to be purely CPU- and memory-bound, but that's not what RRB's results show. There's plenty of room to optimize Rails by optimizing CPU performance, though that's not the whole story.

Is Rails Ruby Bench All Done Now?

Benchmarks often have a kind of "shelf life" built in - by their nature they show a single metric, and at some point you've gotten nearly all the benefit from that metric.

And RRB has needed some adjustments - Discourse version upgrades, for instance, and running more full runs and more HTTP requests per run.

The best evidence I can give that Rails Ruby Bench isn't done is this: I keep finding new, interesting slants for it. Right now (April 2018) I'm trying to measure how much extra speed you can get from Rails by saving memory, and using RRB to do it. I'm trying to figure out how much of MRI's warmup time (it has some!) is from the memory setup and can be removed with environment variables. And soon, RRB will be my go-to metric to see: does JIT speed up Rails? What settings work best?

I think Rails Ruby Bench has more interesting questions to answer in the next year or three. There will, of course, be new efforts of all kinds. And Ruby 3x3 could use more benchmarks as well. But RRB isn't done yet.


Ruby 2.6 preview 1: Timing JIT

The new Ruby 2.6 preview 1 has JIT capability built in. Awesome! But it's still early. They say JIT doesn't help on Rails apps, for instance.

Purely by coincidence, I happen to write a big concurrent Rails-based benchmark, which Takashi was hoping to see JIT results for. And I'm freshly back to part-time work after paternity leave.

So how is its performance for Rails apps? Let's find out.

(Disclaimer: Takashi says that 2.6 head-of-master has significantly better JIT performance than prerelease 1. And I'll get around to timing that soon, too. But for now let's go with the 2.6 prerelease.)

Some Graphs

There's a way I usually graph this stuff. And several people have pointed out that I could do better with a line graph. And they're right, I totally could. So let's look at this how I usually do it, and then with some (I think) improved graphs.

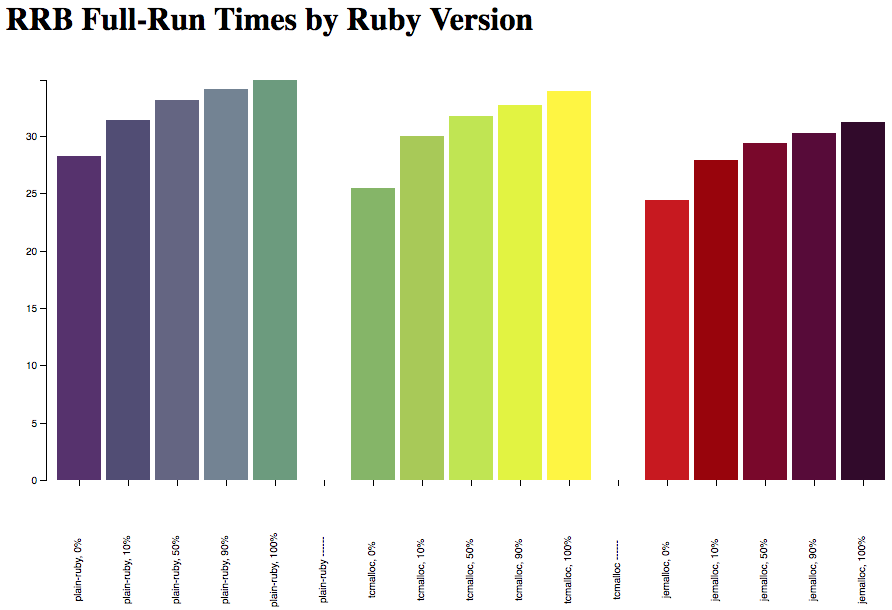
I like the rainbow thing this graph has going. It's pretty. But commenters are right that it could be much clearer.

I like the rainbow thing this graph has going. It's pretty. But commenters are right that it could be much clearer.

That bar graph lets you know: Ruby 2.6.0 prerelease 1 isn't much faster than 2.5.0. But how close? And the 2.6.0 bars with JIT (far right) are higher, so it's slower. But how much higher/slower? I usually clarify with a table, which kind of makes the graph redundant. Here's what that looks like:

Percentile Ruby 2.5.0 Ruby 2.6.0 w/o JIT Ruby 2.6.0 w/ JIT speedup w/ 2.6 speedup w/ 2.6 JIT
0% 29.79 sec 29.69 sec 32.21 sec 0.35% -8.13%
10% 32.62 sec 32.01 sec 36.34 sec 1.85% -11.42%
50% 34.35 sec 33.94 sec 38.34 sec 1.20% -11.60%
90% 35.35 sec 34.89 sec 39.58 sec 1.30% -11.95%
100% 36.75 sec 35.92 sec 40.79 sec 2.25% -11.01%

It says pretty much the same thing: Ruby 2.6 is a tiny bit faster (let's call it 1.5% faster.) And with JIT it's much slower, more than 10% slower. Keep in mind this is a big, highly-concurrent Rails-based benchmark, which is exactly where we were told JIT was slower.

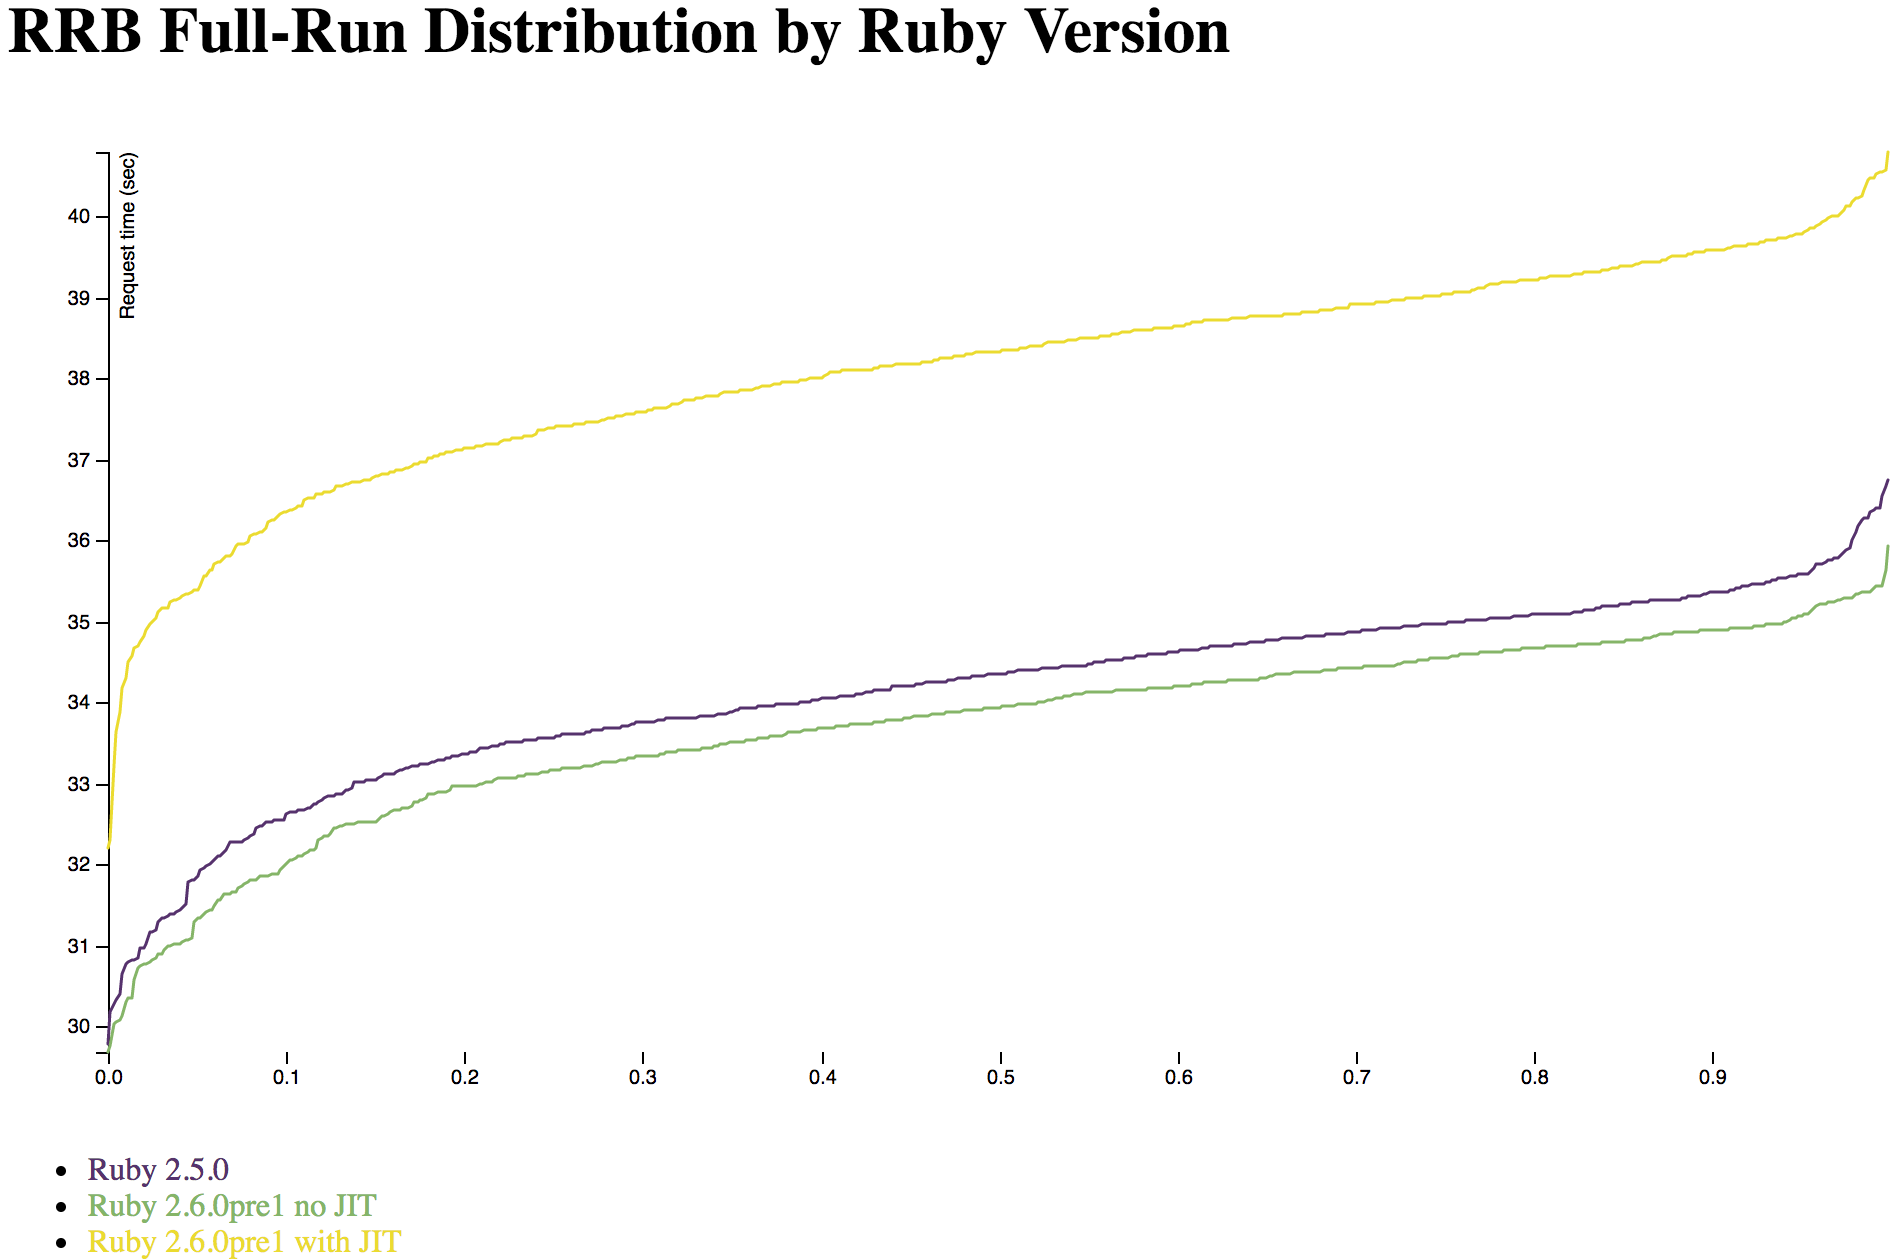
Still, we can do a better job presenting this data, I think. What if, instead of looking at a few representative percentiles of the full-run times, we took all 120,000 requests per Ruby (20 full runs, each with 6,000 requests,) sorted them from fastest to slowest, and overlaid them like a CDF? I think that would give us a pretty good view of how much faster or slower it is. Here's what that looks like:

I don't feel like this is as pretty. There are things I could do to improve it, obviously. But the biggest problem is that it's hard to estimate the total area between the curves in a wide, shallow graph like this. But I agree - this is an improveme…

I don't feel like this is as pretty. There are things I could do to improve it, obviously. But the biggest problem is that it's hard to estimate the total area between the curves in a wide, shallow graph like this. But I agree - this is an improvement.

Note that a small difference like the one between Ruby 2.5 and 2.6 is the worst case for a graph like this. It's about a 1.5% difference, as we saw in the table above. In fact, it's much smaller than that -- the 1.5% difference was aggregated and included a lot of the longer requests, while most requests on this graph are nearly the same between Ruby versions. Very few graphs will do a good job of showing that. And even the 2.6 with/without JIT difference isn't massive, at around 10%. Still, it's hard to recognize even the biggest, most important features of this graph, such as the fact that the slowest requests, with JIT, are much slower. And that's what you'd hope a graph like this would be best at.

Still, it's worth a look at the full-run version rather than the per-request version. Anything that shows every individual request, all 360,000 of them, is going to be, at best, too much information. What about just the 18,000 most important points, the aggregated run times?

Here's what that looks like:

This makes you appreciate the buttery smoothness of the version with far too many points, doesn't it? 18,000 points sounds like a lot when I write it, but it's not really that huge.

This makes you appreciate the buttery smoothness of the version with far too many points, doesn't it? 18,000 points sounds like a lot when I write it, but it's not really that huge.

This is the clearest graph so far, no question. By aggregating the full-run times, you can see that there's actually a lot of difference between the Ruby versions, even if most individual requests are very similar. In 6,000 requests, nearly every run is going to have something that is faster in 2.6, or much slower in 2.6 with JIT.

Also, the Y axis is zoomed in here. Notice that it runs from around 30 to 40 seconds, which is the basic spread for a full run of 6,000 requests for this benchmark. The individual-request graph had to start at zero because some requests are nearly instantaneous, while others take upwards of a second. This lets you see a lot more clearly what it means that the green and purple lines are "about 1.5%" apart - the fastest runs are very close together, the vast majority of runs are nearly a constant factor apart, and there are a few at the end that are outliers -- barely. As graphs go, this is a very orderly, neat one rather than a noisy one with lots of weirdness. Right now, Ruby 2.6 is a small, simple, uniform optimization and its JIT is a smallish, simple, uniform slowdown to this benchmark.

Methodology and Conclusion

Right now you don't want to use Ruby 2.6 JIT for your large, highly-concurrent Rails app, just like it said in the prerelease announcement. That makes sense. And don't worry, I'll be timing the newer 2.6 versions very soon. You'll find out when JIT breaks even for Rails Ruby Bench, and when it gets faster. I'll also try playing with different JIT settings a bit -- if I find anything interesting, I'll let you all know.

In case you haven't read my other articles on Ruby speed, this is all measured using Rails Ruby Bench (aka RRB.) RRB preloads Discourse with a bit of data and runs with with 10 Puma processes and 60 threads, then shoves pseudorandomly-generated HTTP requests through as fast as possible on a single large EC2 dedicated host. This gets more predictable benchmark results than you'd think, for reasons you can read about in my previous posts and on GitHub.

So: when you read about "how fast Ruby 2.6 prerelease 1 is" in this article, you're finding out how its speed looks for a large, real-world, highly-concurrent Rails workload. Other workloads will vary -- the Ruby 2.6 JIT is much faster on optcarrot, for instance.

Benchmarking Ruby's Heap: malloc, tcmalloc, jemalloc

Last week's post talked about different kinds of Ruby objects: some are contained in the 64-bit reference directly, some use up a 40-byte "Slot", and some use a Slot and a chunk of heap. Let's talk about that last set of objects.

"The Heap" isn't specifically a Ruby concept. It's a standard part of Unix processes. Other than garbage collection, Ruby doesn't do much that's special or unusual with the Heap in its processes. So: what's there to talk about?

It turns out that the heap does get managed. The C standard library has a "normal" malloc. But memory allocation is like everything else run by programmers: you have a bunch of different choices with subtle differences between them. And so you have several memory allocators to choose from. There are smart folks who strongly favor nonstandard allocators like tcmalloc and jemalloc, and get great results with them.

Also, I haven't measured anything with RailsRubyBench in a little while. I get itchy. You know how it goes.

(Do you just want to see the pretty graph? I totally understand. Scroll down, it's near the bottom after the explanation.)


What Does Malloc Do?

I won't dive too deeply into malloc -- the information is out there, and mostly it's not what you need to know for Ruby. But let's hit the basics.

Your process uses memory "pages" which it requests from the operating system. They're usually 4 kibibytes (4096 bytes), though it can get complicated. Your memory allocator figures out when to ask the operating system for new pages. It manages chunks of memory that usually aren't 4096 bytes, the ones your program asks for. If you return them later, it manages those too. So it often winds up with a kind of memory Swiss cheese as your Ruby program asks for various sizes of objects and hands them back in a different order.

(Doesn't Ruby use garbage collection? Sure. But when it frees your object automatically, it turns around and frees up that memory using whatever malloc implementation it's using. Just because you don't manually free the memory doesn't mean Ruby doesn't do that. Ruby is written in C, and behaves like it.)

Malloc needs to keep a list of what memory is used and free. It needs to update that list when you allocate or free memory in the Heap. You're asking for more Heap when your process asks for a Page full of Slots. But you don't touch the Heap when you use a Slot in a Page that Ruby already has.


What's the Difference?

If you enjoy reading C code, may I recommend the Dan Luu tutorial on implementing a really basic malloc? It's a great way to start thinking about what malloc does and how it does it. Of course, real malloc is normally a lot more complicated, but it's a good start.

There are a few different commonly-available malloc implementations, aside from whatever version came as part of your C standard library.

The two we'll talk about today are called tcmalloc and jemalloc. You can build or run Ruby with either one. Tcmalloc is part of the Google Performance Tools suite and keeps a thread-local cache for each malloc so you don't have to go to a single big pool of memory for every allocation on every thread. That's not going to help much for an only-processes Ruby application that doesn't use threads... But Rails Ruby Bench uses threading pretty heavily, so you'd think tcmalloc could help a lot.

Jemalloc is the old FreeBSD allocator, separated from FreeBSD. Like tcmalloc, it keeps per-thread chunks of memory and tries to avoid memory fragmentation. It comes highly recommended by Ruby performance luminaries like Nate Berkopec. Both allocators are good, and there are a few interesting differences between them.

So, shall we have a speed shootout?


How Fast?

I'm going to use Ruby 2.5.0 and Rails Ruby Bench for this. So I'm answering the question, "for a big concurrent Rails benchmark, what's the difference in total speed/throughput?" Memory benchmarks are a little odd this way. I'm measuring speed, but making some changes that clearly affect total memory usage. But the memory usage is basically capped by the fact that it's a single m4.2xlarge dedicated EC2 instance running ten Rails processes. So this benchmark answers how better memory efficiency translates into speed with a constant amount of memory, not how little memory you can use.

(Why do we care exactly what/how this measures? For starters, because there's probably a better way to tune Puma for lower memory usage per process. This shootout probably understates how much faster a more efficient malloc is, because it starts with a benchmark that has been carefully tuned for normal system malloc. You might be able to get better throughput with more Puma processes, for instance, or more threads per process. This benchmark doesn't measure that.)

So, what do we measure? I started with normal Ruby 2.5.0, and Ruby 2.5.0 with jemalloc and tcmalloc. I also tried using the memory environment variable settings the page suggested for tcmalloc, but they're entirely within the margin of error - in this benchmark, warmup is serving the same purpose, so on-boot memory settings don't matter enough to be measurable.

jemalloc_tcmalloc_full_runs.png

These are full-run times with Rails Ruby Bench, measured in seconds. In case you're not already familiar with RRB, I'm running Discourse with 10 processes and 60 threads on an EC2 dedicated m4.2xlarge instance in a don't-use-the-network configuration to reduce variation. It's a configuration that's meant to answer, "what's the speed difference for a highly-concurrent Rails application, running as hard as my fairly-large EC2 instance can handle?" There's a 30-thread load tester processes running 6000 requests/batch, and each of these configurations was tested for 60 batches. 60 batches of 6,000 requests gives 360,000 HTTP requests for each configuration. I throw out any batch that has an HTTP error, but in this case none of the 180 batches got any errors. It does happen for some benchmarks because HTTP is like that.

That graph is reasonably pretty, but it's hard to pull a specific percentage out. Let's put the numbers in a table and check percentages, shall we?

Percentile CRuby 2.5.0 2.5.0 w/ jemalloc 2.5.0 w/ tcmalloc speedup w/ tcmalloc speedup w/ jemalloc
0% 28.22 sec 24.45 sec 25.45 sec 9.82% 13.38%
10% 31.41 sec 27.86 sec 30.03 sec 4.40% 11.30%
50% 33.13 sec 29.40 sec 31.72 sec 4.27% 11.25%
90% 34.12 sec 30.28 sec 32.70 sec 4.15% 11.25%
100% 34.87 sec 31.17 sec 33.90 sec 2.80% 10.62%

Overall we're getting about an 11% speedup with jemalloc here, and a much more variable speedup, between 3% and 10%, with tcmalloc. That makes sense, and matches the reports I've heard of both jemalloc and tcmalloc. Note that this is with no additional tuning (e.g. no change in the number of processes or threads,) and none of these got a single server error in the 360,000 requests they each handled. So: reasonably solid.

(I've run these numbers and gotten as low as 9% speedup for jemalloc before as well. But the speedup is still in a similar range.)

When I check throughput rather than runtimes I usually get a smaller speedup - total throughput uses the slowest of the runs as the total time, so it nearly always shows less speedup. What's interesting here is that that's clearly true of tcmalloc... But jemalloc gets great results on throughput, suggesting a very consistent speedup (as you see above as well):

CRuby 2.5.0 jemalloc tcmalloc increase w/ tcmalloc increase w/ jemalloc
Median Throughput 175.13 req/sec 197.49 req/sec 183.33 req/sec 4.68% 12.77%


Conclusions

It looks like the jemalloc advocates have a darn good point. That makes sense. Richard Schneeman and Nate Berkopec are the kind of folks who would know. It looks like jemalloc gives conservatively an 11% speedup for a big concurrent Rails app. Tcmalloc is more variable but still hits 4%-9% speedup or so, which is nothing to sneeze at. Remember that this is overall speedup - not just when allocating memory, but for the full Rails app's runtime and throughput.

Among other things, this should tell you that heap management is important in Ruby. If you weren't seeing many bytes allocated on the heap, or if heap management was really fast, there wouldn't be a 10% speedup to give!

How Fast is Ruby 2.5.0?

Back in November, I posted speed results for Ruby 2.5.0 preview 1. It was barely faster than Ruby 2.4, which was a bit of a disappointment. However, one very important performance patch landed before it finished, which made a big difference in the final speed.

How big? Let's see, shall we?

Quick Graphs

You just want to see the graphs, I'll bet. I'm the same way. Here's a great start: total-time runs for Rails Ruby Bench. This measures the time taken to push a mixture of Discourse (Rails) requests through a big concurrent server:

Yup, those bars on the right are shorter.

Yup, those bars on the right are shorter.

So: not bad. What's that look like as a table of numbers and percent faster?

PercentileRuby 2.4.3Ruby 2.5.0% Faster
0%29.1726.997.5%
10%32.2530.734.7%
50%33.9832.394.7%
90%35.1533.375.1%
100%36.7735.623.1%

What's interesting here is that the higher (slower) runs gained less speed, which isn't usually how it works. That's almost certainly because of the unusual nature of the performance patch that was nearly all the speed difference: it was a more-or-less constant overhead per Ruby bytecode operation. If the slower runs had instructions that each took longer (pretty likely) then you'd expect them to gain less performance. Which is roughly what you see here.

If we asked, "sure, but what's the overall number? How much faster is Ruby 2.5.0?," I'd probably wind up answering in throughput, not the percentile per-run time. So let's look at throughput:

MeasurementRuby 2.4.3Ruby 2.5.0% Faster
Mean Throughput170.6179.35.1%
Median Throughput171.0179.65.0%

How much faster? 5% faster for throughput on a big concurrent Rails server. Tell your friends!

Can it be faster than that? Sure. With a lot of small, faster operations I was seeing up to 7.5% faster on Rails requests, and Koichi was seeing up to 12% faster on some benchmarks.

But for the simple answer, "will it make my Rails app faster?" Yes. About 5% faster. Which isn't bad for a pretty calm upgrade that isn't likely to break anything. It'll just speed up your code and add a few nice features!

CRuby Memory Slots: See Them, Tweak Them, Make Them Fast

You've probably read a lot about how Ruby handles memory over the years. If you haven't: there's a lot. Ruby is a dynamic language, and managing memory in dynamic languages is complicated. Managing memory well and fast in dynamic languages is usually very complicated. For instance, here's a very simple summary of how garbage collection works in Java. It's similar -- and complex.

Mostly you don't have to care. Most Java developers don't know that whole summary and most Ruby developers understand only a small fraction of how Ruby memory management works. Yay! If you had to know all that to write a program, it would be terrible.

You care about the specifics of how Ruby manages memory if you're optimizing: if you're trying to make your program faster, or have it run in less memory. Let's talk about how Ruby memory works, and how you can tweak it.

We'll talk about the Slots that Ruby uses - what they are, how you check them and how you optimize them.


Ruby Objects: Cheap, Cheaper, Expensive

Ruby has references. And mostly those references point to objects. The Ruby source code calls the references VALUEs, and they need to fit into 64 bits.

Tiny Ruby objects like "nil" and small integers don't get any allocation besides their reference - the number seven, for instance, doesn't get an object allocated to it (sorry, seven!) It gets stored inside the VALUE using bitwise trickery. Ruby doesn't keep an extra copy of seven, or a single frozen copy of seven or something. So tiny objects don't really count in terms of allocated memory or garbage collection. An Array of them can, though -- the Array holds a lot of references (VALUEs.) And while each reference doesn't get a Slot, the Array itself does.

What counts as "tiny?" Integers that Ruby can store in 31 bits or less, between around negative one billion and positive one billion. True, false, undef and nil. Floating point numbers. Symbols. There's a bunch of C code showing how they get encoded into VALUEs.

Every Ruby object that isn't encoded into its VALUE gets a 40-byte "slot". The Ruby structure in the slot is called an RVALUE. Some objects are small enough to fit entirely into a single Slot, such as an Array with up to 3 elements, a smallish Bignum or an Object with only a few instance variables. Ruby says these values are embedded in their RVALUEs if they fit there completely. Since every slot is 40 bytes, Ruby allocates them in big chunks called "pages" for efficiency. So instead of one allocation per Slot, Ruby does one allocation per page of 408 Slots. 408 is how many 40-bytes objects fit into a 16kb memory page after a bit of header overhead.

Objects too big to fit inside a Slot get both a Slot and a chunk of Heap. Heap is "extra" space for bigger Objects. Heap is allocated with normal C malloc unless you build a custom Ruby to do something different. Chunks of Heap take a lot more work to allocate and free. The require more memory and a lot more CPU. A page of Slots still gets allocated via malloc. But it takes one malloc per 408 Slots instead of one malloc per single object. So objects that fit inside a Slot are much cheaper. (Curious about more details? Pat Shaughnessy's Ruby Under a Microscope covers this extensively in chapter 5.)

Here's something interesting: Ruby can't easily reassign a slot. If you use a Slot and later free the object, Ruby waits until all the Slots on that page are free and then frees the page. Ruby doesn't reassign that Slot to a new object, just in case somebody (I'm looking at you, C extensions!) is holding onto a pointer and messes with the new object, thinking it's the old object. Aaron Patterson is trying to fix this, but that's all experimental. Right now, Ruby doesn't free a page unless all the Slots in it are free.


Becoming a Slot Whisperer

Okay, so how do you track Ruby Slots? The first thing you do is call GC.stat. (Disclaimer: GC.stat changes between Ruby versions and depending how you compile your Ruby, so you may see a slightly different set of keys in the hash table!)

If I pop into irb in Ruby 2.3.1, here are the GC stats I see:

hostname:ruby noah.gibbs$ irb
2.3.1 :001 > GC.stat
 => {
   :count=>11,
   :heap_allocated_pages=>132,
   :heap_sorted_length=>133,
   :heap_allocatable_pages=>0,
   :heap_available_slots=>53802,
   :heap_live_slots=>48358,
   :heap_free_slots=>5444,
   :heap_final_slots=>0,
   :heap_marked_slots=>20752,
   :heap_swept_slots=>20813,
   :heap_eden_pages=>119,
   :heap_tomb_pages=>13,
   :total_allocated_pages=>132,
   :total_freed_pages=>0,
   :total_allocated_objects=>184094,
   :total_freed_objects=>135736,
   :malloc_increase_bytes=>13040,
   :malloc_increase_bytes_limit=>16777216,
   :minor_gc_count=>8,
   :major_gc_count=>3,
   :remembered_wb_unprotected_objects=>201,
   :remembered_wb_unprotected_objects_limit=>364,
   :old_objects=>20081,
   :old_objects_limit=>33674,
   :oldmalloc_increase_bytes=>1786560,
   :oldmalloc_increase_bytes_limit=>16777216
 }
2.3.1 :002 >

That's fairly imposing. But you know enough to interpret some of it. Let's talk about that.

"Major GC count" and "minor GC count" are just counting how many times Ruby has garbage collected. These are just how many times they've happened. And "count" is just major plus minor.

"Heap live slots," "heap free slots" and "heap final slots" are about Slots - that's what we're looking for. "Live" slots have objects in them, "free" slots don't, and "final" slots are waiting to be cleaned up and garbage collected.

Pages are also important. "Tomb" pages have no live objects and can be handed back to the operating system. "Eden" pages have live objects. Remember how there are 408 slots per page? We can find out how many of those pages are hanging out in memory.

(Want more detail on all the bits of GC.stat? Here's Nate Berkopec's blog post for that, and you can expect more posts from me as I talk more about Ruby memory.)


The Hideous Secret of Fragmentation

Ruby can't free a page until all the Slots are free. What does it do with a page of 408 Slots when three last Slots never get un-referenced?

Short answer: they stick around forever, if you never unreference those last few.

This results in fragmentation - all your pages have a combination of used and unused slots. If you have a lot of pages with only three real objects each, that results in very bad fragmentation of Slots. You're allocating space for 408 and using 3. Not so good.

The word fragmentation can mean several different things. This "Slot fragmentation" doesn't happen in a language that only uses malloc and free, because there are no Slots. In languages that only use malloc/free there are two kinds of fragmentation. "Internal fragmentation" is extra space added to each block of allocated memory. "External fragmentation" is extra space in between chunks of allocated memory. So: keep in mind that there are at least three different ways to measure fragmentation that might apply to Ruby. "Slot fragmentation" is one.

So how do you measure Slot fragmentation? Like this:

stat = GC.stat
used_ratio = stat[:heap_live_slots].to_f / (stat[:heap_eden_pages] * 408)
fragmentation_ratio = 1.0 - used_ratio

You take the number of eden (live) pages from GC.stat, multiply by 408, and then see how many objects you have inside those pages. You don't expect the fragmentation ratio to be exactly zero - that's only true if you exactly fill every Slot and you happen to have a multiple of 408 objects and no waste at all. But if you see your fragmentation ratio get around 0.2 or 0.3, you're wasting a lot of space - 70%-80% of your total Slots. A freshly-booted irb session has about a 0.006 fragmentation ratio, or a 0.994 "used" ratio.

You also expect the fragmentation to increase over time for a running process, because you'll have the occasional stray page with a few objects you can't free. But if Slot fragmentation keeps increasing, you're probably doing something wrong.

Nate Berkopec says that if your process size goes up asymptotically -- approaches a line, slowly getting nearer and nearer -- then that's fragmentation, and mostly it's fine for a long-running process. But if your process size goes up linearly -- the same amount per hour, every hour -- then that's a memory leak and you need to hunt it down.

Using Your Slot Savvy

Okay, so now you know how to measure fragmentation. What do you do if it's too high?

  • See if you can do your allocations in a big block. Ruby makes it easy to autoload, but it's often better to load everything up front, where all your "keep them forever" classes and data will wind up on the same pages. That can make your fragmentation ratio significantly better.
  • If you have big chunks of data that you allocate on demand, try to do it right at the beginning. Not only will it not wind up in a page of freed data from a later request, it's more likely to wind up on the same pages with your early classes and code from last paragraph.
  • Any time you can avoid keeping a reference around, don't keep it around. The fastest memory management is always no memory management.
  • Do you have a structure that slowly grows or changes? That can be hard. But try to touch it in batches, where lots of allocations will wind up on the same page instead of scattered across many different pages.
  • Do you have a cache that's small and never cleared? If so, maybe you want to make it a permanent allocation up front, or get rid of it entirely.

And finally, don't sweat fragmentation too much. Each page is about 16 kilobytes (technically kibibytes, if you're a pedant.) If you're wasting 100,000 of them, that's worth a look. If you're wasting ten of them... It's 160kb. 

I'll be back next week or so with another lesson about Ruby memory!

How Much Does Meltdown/Spectre Patching Slow Down a Big Rails App?

You've likely heard about the Meltdown and Spectre bugs that affect nearly all modern CPUs. You've probably heard that the patch to fix them costs some performance. You'll hear between a 5% and 20% penalty or more, depending who you ask and about what benchmark.

So how does that affect Rails Ruby Bench, a highly-parallel real-world Rails workload? Ubuntu now provides patches for Meltdown and Spectre (approximately -- see below), so let's find out!

(Why so late? The original coordinated worldwide release date for Meltdown and Spectre was January 9th but Ubuntu took until January 22nd to release full patches for all three CVEs... Which means I heard about them long before I could patch for them, because the Ubuntu patches weren't out yet. D'oh!)

If I ever become a major security vulnerability, I'm gonna hold a small, picturesque stick just like the "Spectre" ghost.

If I ever become a major security vulnerability, I'm gonna hold a small, picturesque stick just like the "Spectre" ghost.

Old and New

On January 22nd Ubuntu got patches out for all three variants of Meltdown and Spectre -- but with several major disclaimers about hypervisors and hardware. And if you check with a Spectre/Meltdown vulnerability checker, it doesn't look like everything is patched yet for yesterday's Ubuntu Xenial AMI, fully patched, on AWS (see the output below.) So there may be a future slowdown when this is fully patched.

I started from my previous AMI configuration with a beta Discourse 1.8.0 version and Ruby 2.3.4 and 2.4.1. We want a nice well-known baseline for checking this. I have lots of numbers for these Discourse and Ruby versions from before the update. And the Spectre and Meltdown slowdowns depend on the workload, but it's going to be very similar for Discourse 1.9 and Ruby 2.5.

Each of these results is based on 20 batches of 6000 requests for each Ruby/Discourse/patchlevel combination. They're all configured with 30 load-tester threads and 10 server processes, each with 6 server threads. It all runs on an AWS m4.2xlarge dedicated instance but it's not doing network I/O. I used 100 warmups for each process before running the 6000 requests. All of this is my normal config for Rails Ruby Bench, and the configuration I always use unless I have a specific reason to diverge from it. In other words if you've been following this blog, it's the same thing you've been seeing.

So let's look at some numbers (at the next section heading.)

meltdown_vuln_checker.png


Graphs and Numbers

I have a lot of results for Rails Ruby Bench from before the patch - the results are pretty stable. But I've included some of them here for your reference -- those are the "pre-patch" numbers. I also took some measurements after the January 9th patch but before the Jan 22nd patch. Those are the "partial patch" numbers, which includes both the Ubuntu Jan 9th patch and the AWS server reboot to patch the hypervisors. And finally there are the "patched" numbers, which includes the Jan 22nd patch and is taken based on the latest Jan 22nd official Ubuntu cloud AMI. Again, there may be later patches -- the vulnerability checker does not think everything is taken care of and the Ubuntu announcement has a lot of disclaimers.

Below, have a quick look at the graphs and optionally the table of results. That's... surprising, at least to me. I am not seeing a 5% to 20% decrease in performance. In fact, while there's a bit of a performance hit from the Jan 9th patch, it seems to have bounced back completely to the original performance with the Jan 22nd patch. These are dedicated AWS instances and not doing network I/O outside the instance, so you shouldn't be seeing noisy neighbor problems -- these numbers have been surprisingly stable month by month, so if there were a 5% drop, you'd definitely expect to see it. These results are so close that there may be no difference, it may be entirely swamped by noise in the measurement.

There's a bit of a drop in the middle, but not much. And the right (patched) results are just as fast as pre-patch.

There's a bit of a drop in the middle, but not much. And the right (patched) results are just as fast as pre-patch.

Ruby VersionPatch StatusThroughput
2.3.4Pre-patch161.8
2.4.1Pre-patch166.4
2.3.4Partial159.8
2.4.1Partial164.6
2.3.4Patched164.5
2.4.1Patched167.0


Conclusions

My guess, based on the data, is that the initial Meltdown and Spectre patches on Jan 9th gave a very small performance penalty, something in the range of 0%-5%, for a large parallel Rails app. But not a lot. It's impossible to tell from this data if that was the Ubuntu patches, the Amazon AWS patches, or both.

But as of Jan 22nd, I am seeing no slowdown whatsoever for concurrent Rails performance with the current Meltdown and Spectre patches. There are reasons to believe that these patches aren't complete (see above.) So it's too early to call it long-term. but I'm not seeing a lot of reason for concern, so far.

Might this be that Rails is I/O-bound? Maybe CPU slowdowns don't matter because Ruby is already so fast that CPU isn't a bottleneck? It's possible, but I don't think so. That same rationale is given every year for why new Ruby changes won't speed up Rails -- Rails does have an I/O-heavy workload, and presumably at some point it will become very hard to optimize it. But Rails on CRuby is still slower than many other web frameworks (e.g. Dropwizard or Torquebox.) And Ruby keeps speeding up Rails every year - with more speedups coming. So I don't think we've hit that point yet, and I definitely don't think a CPU slowdown from Spectre patches would go completely unnoticed.


Quickie: Building Ruby with Memory Profiling

Ruby's garbage collector has some really interesting memory profiling capabilities. If you build with them turned on, they'll be reported as extra entries in GC.stat.

But how do you turn them on? I mean, without downloading the Ruby source code and configuring everything manually...

If you use rvm, it's pretty easy:

cflags="-D RGENGC_PROFILE=2 -DRGENGC_PROFILE_MORE_DETAIL -DRGENGC_PROFILE_DETAIL_MEMORY -DPROFILE_REMEMBERSET_MARK" rvm install --disable-binary --reconfigure 2.4.1-gcprofile

When you use "rvm --disable-binary --reconfigure" you're making sure it rebuilds Ruby even if it could give you an off-the-shelf binary. When you ask for "2.4.1-whatevername" you're saying to install CRuby 2.4.1 with the name you picked -- above, that name is "gcprofile" because I'm turning on GC profiling. So I can "rvm use ruby-2.4.1-gcprofile" to run with it.

All of that other stuff where I'm setting "cflags" to define a whole bunch of C constants? That's what turns on all the GC profiling. If you think that's a fun thing to do, switch to your new GC-profiling-enabled Ruby, pop into irb, and start checking "GC.stat" after various operations.

There are also some fun things you can do with GC::Profiler:

2.4.1-gcprofile :003 > GC::Profiler.methods.sort - Object.methods
 => [:clear, :disable, :enable, :enabled?, :raw_data, :report, :result, :total_time]
2.4.1-gcprofile :004 > GC::Profiler.enabled?
 => false
2.4.1-gcprofile :005 > GC::Profiler.enable
 => nil
2.4.1-gcprofile :006 > 10_000.times { "bob" + "notbob" }
10    1    27    45
1    6    38    38
 => 10000
2.4.1-gcprofile :007 > GC::Profiler.report
GC 14 invokes.
Index    Invoke Time(sec)       Use Size(byte)     Total Size(byte)         Total Object                    GC Time(ms)
    1               0.085               648160              1354560                33864         1.39699999999999535660
    2               0.087                    0                    0                    0         0.27699999999995783551
 => nil
2.4.1-gcprofile :008 > GC::Profiler.disable
 => nil

I hope you'll have a little fun checking it out. I am!

Ruby and Nested Exceptions

Often, one exception causes another.

A library tries to read a configuration file with File.read, which raises an exception of type Errno::ENOENT with the message "No such file or directory @ rb_sysopen". That library then raises another exception to let you know: it couldn't find its configuration, possibly after looking in several different places.

Older versions of Ruby used to throw away this inner exception. The library rescued the "no such file" exception, swallowed it, and raised an entirely new one. Indeed, some libraries still do. Folks like Avdi Grimm and Charles Nutter were in favor of the inner exception sticking around. Ruby isn't the only language to do this. It's common practice in other languages like Java and .NET. You'll even see recommendations for wrapping all exceptions in your library's version, even in Ruby.

And so in recent Ruby, if you raise an exception from the "rescue" block of another, it saves the inner exception. If you rescue the new exception, you can call "cause" on it to find the inner one! (You can also do it differently, but that's documented poorly - I'll show you the secret way to do it if you read all the way to the bottom of this post.)

2.3.1 :003 > begin
2.3.1 :004 >       begin
2.3.1 :005 >           raise "Inner message"
2.3.1 :006?>       rescue
2.3.1 :007?>         raise "Outer message"
2.3.1 :008?>       end
2.3.1 :009?>   rescue
2.3.1 :010?>       nest_e1 = $!
2.3.1 :011?>   end
 => #<RuntimeError: Outer message>
2.3.1 :012 > nest_e1
 => #<RuntimeError: Outer message>
2.3.1 :014 > nest_e1.cause
 => #<RuntimeError: Inner message>

This means that sometimes you can find really interesting information if you look a bit. If the library handles its "no such file or directory" with a rescue and a raise, the error underneath is captured right in the new exception!

Of course, you have to look for it. You don't see the nested exception unless you call "cause" on an exception:

2.3.1 :013 > raise nest_e1
RuntimeError: Outer message
    from (irb):7:in `rescue in irb_binding'
    from (irb):4
    from /Users/noah.gibbs/.rvm/rubies/ruby-2.3.1/bin/irb:11:in `<main>'
2.3.1 :014 > nest_e1.cause
 => #<RuntimeError: Inner message>

But if you can catch the exception and have a look, you can print it out. That's not terrible, but maybe we can do better.

Customizing with Minitest

I use Minitest, and when I get an exception I often want to see what's gone wrong. Even if Ruby's not showing us the problem, maybe we can hook into our test framework?

As it happens, we definitely can!

# test_helper.rb
class Minitest::UnexpectedError
  def message
    # Build a chain of exception causes
    exc = self.exception
    cause_chain = []
    loop do
      cause_chain.push(exc)
      exc = exc.cause
      break unless exc
    end

    bt_lines = cause_chain.map { |c|
      [c.message] + Minitest.filter_backtrace(c.backtrace)
    }.inject() { |acc, bt| acc + ["... Caused By ..."] + bt }
    bt_out = bt_lines.join "\n    "
    return "#{self.exception.class}: #{self.exception.message}\n    #{bt_out}"
  end
end

Note that this technique isn't limited to nested exceptions and causes. An exception object can have anything you want, and you can hook into minitest and print out the extra information. Just generate a string of your choice. You're basically writing a Minitest mini-plugin into your test helper, which is a pretty common thing to do...

For nested exceptions, I've already opened a pull request for Minitest - we'll see if it makes it in!

It looks like the Ruby folks also think we should print the causes for exceptions, but just haven't gotten around to it yet...

Secrets

So if you can set the cause by raising your error from the "rescue" clause, that's okay. But what if you want to do it from somewhere else?

Can you pass the cause to the constructor for your new Exception?

Hm... Not so much, it turns out. There was some debate about it in the bug report, but no.

Instead, there's a secret keyword to "raise" that will let you set a cause if $! isn't set, or override it if it is:

raise MyOuterException.new("oh no!"), cause: MyInnerException.new("ducks!")

Shh... Don't tell anybody. It's a secret. I had to get it out of the Ruby source code and tests, so I assume nobody wants you to know...

Why Do I Care?

Now you know about Ruby's nested exceptions. You care if an exception might have extra information you need for debugging - now you know to catch it and print out the exception's cause... And maybe the cause's cause, and so on.

You care if your test library or REPL is catching and printing an exception but doesn't let you see the cause, like Minitest above. But this same problem applies to RSpec, Test::Unit and even irb or pry - if they're printing the exception but not the cause, you don't get to see it.

And you care if you're writing a gem - be sure to raise your exception from the 'rescue' clause so that folks can see what exception caused the exception! See the Secrets section above, in case your gem's structure is a bit more complicated.