ABProf: An Accurate Statistical Profiling Harness

ABProf is a tool to compare which of two programs is faster. It can prove that a particular optimization worked, which is my job these days.

We talked about the easy-to-use version of ABProf recently. Let's talk about the more powerful and accurate version now. It's a bit harder to use, but often worth it.

To follow this post, first install abprof: "gem install abprof" will generally do it.

A Simple Example

Let's look at the simple version of the harness code. The below example sets up a block for sampling -- ABProf will run it repeatedly to check it for speed.

#!/usr/bin/env ruby

require "abprof"

puts "ABProf example: sleep 0.1 seconds"

ABProf::ABWorker.iteration do
sleep 0.001
end

ABProf::ABWorker.start

This is written in ABProf's worker DSL (Domain-Specific Language), which is different from its benchmark DSL.

This DSL is used to set up a worker process for ABProf. Normally ABProf will run two workers and use them to check which of two processes is faster, unless you run it "bare" and supply a block of Ruby. Bare, it will run the block from ABProf's own process. Running in a single process is fast but limits you to a single version of Ruby in-process (and a few other things.)

So: the benchmark DSL sets up a test between two workers (command lines, number of trials to run, desired accuracy, etc.), or you can just specify all that from the command line. The worker DSL sets up a single worker, or you can skip it and get worse accuracy when measuring.

Why worse accuracy? Because being able to do just one specific action is better than doing that plus having to start up a new process. The most accurate measurement is the one that does nearly nothing except measuring. Also, just running what you need instead of spinning up a new process is a bit faster. So without harness code, abprof takes longer to converge, and you wait longer for your benchmarking.

If you wanted to do an A/A test of sleep.rb against itself, you'd run abprof this way:

abprof examples/sleep.rb examples/sleep.rb

You can also pick how many trials to run, how many times to run the block per trial and many other options. Run "abprof --help" for the full list and default values. Here's an example:

abprof --pvalue=0.001 --min-trials=10 examples/sleep.rb examples/for_loop_10k.rb

By default, abprof runs your code block or your program a fair number of times -- 10 before it starts measuring, 10 per trial run. For something very slow (e.g. 5 minutes per run) you'll probably want fewer, while for something fast like a tight "for" loop you'll probably want many more. 10 times isn't many when you're benchmarking small, tight code.

The two commands, abprof and abcompare, are very similar. If you run abprof in "bare" mode with two command-line programs, you're getting the same thing as abcompare.

A More In-Depth Example

The example above is pretty simple - the block runs a single iteration. We can get better accuracy by running several at once, or by having the code measure in a specific way. ABProf supports both of these modes by changing the method used to supply the block. In the above, that method is called "iteration" and it times very simply. If you call the method "iteration_with_return_value" and return a measurement, you can time it yourself.

Here's an example:

#!/usr/bin/env ruby

require "abprof"

puts "ABProf example: sleep 0.1 seconds"

ABProf::ABWorker.iteration_with_return_value do
t1 = Time.now# Can also be a counter
  sleep 0.01
  (Time.now - t1)# Return measurement
end

ABProf::ABWorker.start

This can be useful if you need to do setup or teardown for every iteration, or if you want to measure a counter rather than time, or if you have some kind of custom timer that you want to do yourself rather than using Ruby's built-in Time.now() for timing, as ABProf does.

Be careful - ABProf will tell you it's returning the lower command. When the measurements are time, lower means faster. But if you return a counter or other higher-is-faster performance measurement, ABProf will consistently return the lower result, which may not be what you expect. That's why ABProf keeps printing "faster?" with a question mark to the terminal. If you return something other than a time, lower may not mean faster.

Randomly: don't use an explicit "return" in the block. It's a block, not a lambda, so "return" won't do what you want. Just add the return value as the final one, as in the example above.

Conclusion

So: want better accuracy than with abcompare? Want to take out process startup time as a factor? Use abprof.

Want to do your own timing, or otherwise control it more? Use the "iteration_with_return_value" method instead of just "iteration", and return a value. Also, use abprof.

Want to just quickly, roughly see if something is a lot faster? You can keep using abcompare. But it'll take longer to be sure, so if you're going to keep doing it, use abprof.


ABProf: Profiling Ruby Like an A/B Tester

Lately I've been trying stuff out with Ruby configurations, and inlining functions when compiling Ruby and trying to tell if they made anything faster. That's harder than it sounds -- the standard benchmarks for Ruby are kind of noisy. They give slightly different answers from run to run. It's a pretty common problem in benchmarking and profiling. How can I tell if I'm actually making things consistently faster or just fooling myself?

If I take a lot of samples, then maybe the dark power of statistics could tell us if one way was consistently faster?

Turns out: YES! In fact, I'm not even the first person to do this with optcarrot, though they use the tests for something slightly different.

I built a simple tool, called ABProf, to do it. Let's talk about that.

The Basics

We want to run optcarrot with two different Rubies and see which is faster, with what likelihood, and by how much. But we don't need a Ruby-specific tool to that -- the tool can just run two benchmarks without knowing what they are and do a statistical test. So that's what ABProf does.

Specifically, it installs a command called "abcompare" to do that.

The abcompare command is simple. Give it two command lines:

abcompare "sleep 0.01" "sleep 0.0095"

And it'll spend some time to tell you that, yes, one is faster than the other. It'll even tell you how much faster one is than the other, roughly. The output will look something like this:

Trial 3, Welch's T-test p value: 0.0032549239331043367
Based on measured P value 0.0032549239331043367, we believe there is a speed difference.
As of end of run, p value is 0.0032549239331043367. Now run more times to check, or with lower p.
Lower (faster?) process is 2, command line: "sleep 0.0095"
Lower command is (very) roughly 1.0445033124951848 times lower (faster?) -- assuming linear sampling.
Process 1 mean result: 1.3370193333333333
Process 1 median result: 1.342169
Process 2 mean result: 1.2836166666666664
Process 2 median result: 1.284983

Yup. And with one command being around 5% faster, even a very quick, rough test like this says it's around 4.4% faster. Not too shabby. Decrease the P value or increase the trials or iterations per trial for more exact results.

exe/abcompare --pvalue 0.001 --iters-per-trial=10 --min-trials=10 "sleep 0.01" "sleep 0.0095"

You'll get less exactness if you pick two things that are very close, where starting the process takes most of the time.

abcompare "echo bob" "echo bologna sandwich with mayonnaise"

The above lines compare equal, because echo is so fast (compared to the time to start the process) you just can't see the difference. There's a more exact version of abcompare in development to help with this.

The Ruby-Tinted Truth

Want to check if one Ruby or another is faster when running optcarrot, a subject near and dear to my heart? You'll need to cd into the appropriate directory and use "runruby" to make sure you get the right environment. Also, you'll probably want to see the abcompare output as it goes, so your command shouldn't print to console. And you need to make the total number of times to run it be sane -- if every test takes a few seconds, running many hundreds of them takes quite a long time.

Also, a way to make optcarrot profile better - its benchmark mode is the same as "--headless --print-fps --print-video-checksum --frames 180", so you can use that, but increase the number of frames and not pay the process startup overhead so many times. Nifty!

With all that taken care of, here's how to do it with two built Rubies in "vanilla_ruby" and "inline_ruby_2500".

abcompare "cd ../vanilla_ruby && ./tool/runruby.rb ../optcarrot/bin/optcarrot --headless --print-fps --print-video-checksum --frames 1800 ../optcarrot/examples/Lan_Master.nes >> /dev/null" "cd ../inline_ruby_2500 && ./tool/runruby.rb ../optcarrot/bin/optcarrot --headless --print-fps --print-video-checksum --frames 1800 ../optcarrot/examples/Lan_Master.nes >> /dev/null" --iters-per-trial=1 --min-trials=10 --pvalue=0.001 --burnin=2

This is also a great example of using abcompare with a nontrivial program. Consider putting this long command into a shellscript to run repeatedly :-)

You can get better measurement with the more advanced ABProf version in development, the one that's a bit harder to use... This one is counting startup time as part of the total, so you'll see 5% improvement instead of the 7% improvement mentioned in a previous post... Don't worry, there will be another post on the more exact version of ABProf!

More Better Awesomer Later

ABProf can use a harness of Ruby code, kind of like how Ruby-Prof does it. That's to let it run without having to start a new process on every iteration. Process startup time is slow... and worse, it varies a lot, which can make it hard to tell whether it's your benchmark or your OS that's slow. When you can, it's better to just run your benchmark in a single, longer-lived process.

At the very least you should have the choice to do it that way. The same command can also handle a fun DSL to configure your various tests in more complicated ways...

But for right now, abcompare will do what you want, and do it pretty well. It just takes a few extra iterations to make it happen.

Look for another blog post on how to do this very soon.

What's My Takeaway?

Want to prove you made something faster? Use abcompare. To prove you have the amount of speed-up right, increase the number of iterations per trial, or increase the number of minimum trials, or decrease the P value.

Want to check which of two Rubies is faster? Build both and use abcompare.

Need to prove that something already pretty darn fast is now faster? Do the operation many times per trial or wait for the newer, spiffier ABProf to bring you a way to prove it.


Speed Up Ruby By 7-10% Or More

These days, my job is to speed up Ruby (thanks, AppFolio!) One way to do that is by careful configuration options for building the Ruby source. Let's talk about a nice recent discovery which may help you out. It works if you use CLang -- as Mac OS does by default, and Linux easily can. CLang is intended to be the next GCC by replacing it with a fully-compatible LLVM-based successor. CLang is most of the way there, and ships by default on the Mac. It's available pretty much everywhere. In addition to MacOS, we'll also talk about this speedup on CentOS, a popular OS to deploy Ruby over top of.

Function Inlining

By default, GCC will inline functions on the higher optimization levels. That is, for short, simple functions, it will just substitute the whole function body where you called the function. That lets you skip a function call at runtime. But more important, it lets the compiler skip parts of the function that aren't used, special-case for the parameters that get passed in and otherwise speed up the code.

The down-side is that the code gets bigger - if you put in the full function definition at each call site, things get big. So there's a balancing act for how big a function you inline -- if you inline huge functions it doesn't buy you much speed and the code gets huge. If you never inline anything, the code is as small as it can be, but also slow.

CLang has an easy way to tune what size function you inline. It has an internal metric of how big/complex a function is, and a threshold (default 225) for where it inlines. But you can turn that threshold way up and inline much bigger functions if you want to.

The result is a bit hard to measure. I'll write another blog post on the stats-based profiler I wrote to convince myself that it does speed things up noticeably. But I'm now convinced - with higher inlining settings, you can make a Ruby that's faster than vanilla Ruby, which uses -O3 and the default inlining threshold of 225.

How Big? How Fast? (Mac Edition)

I'm using a standard Ruby benchmark called optcarrot to measure speed here as I tend to do. I'm adding inlining options to Ruby's defaults for optimization ("export optflags='-O3 -fno-fast-math -mllvm -inline-threshold=5000'"). Each of the measurements below used hundreds of trials, alternating between the two implementations, because benchmarks can be noisy :-/

Still, how much faster?

  1. cflags="-mllvm -inline-threshold=1000": about 5% faster?
  2. cflags="-mllvm -inline-threshold=1800": 5% faster
  3. cflags="-mllvm -inline-threshold=2500": 6% faster
  4. cflags="-mllvm -inline-threshold=5000": 7% faster

Those Rubies are also bigger, though. Plain Ruby on my Mac is about 3MB. With an inline threshold of 1000, it's about 4.8MB. At a threshold of 2500, it's about 5.5MB. With a threshold of 5000, it's about 6MB. This doesn't change the size of most Ruby processes, but it does (once per machine) take that extra chunk of RAM -- a 6MB Ruby binary will consume 3MB of additional RAM, over what a 3MB Ruby binary would have taken.

Note: these may look linear-ish. Really they're just very unpredictable, because it depends which functions get inlined, how often they're called, how well they optimize... Please take the "X% faster" above as being noisy and hard to verify, even with many trials. The 1000-threshold and 1800-threshold are especially hard to tell apart, says my statistical profiling tool. Even 1000 and 2500 aren't easy. Also: measured vs recent MacOS with a recent Ruby 2.4.0 prerelease version.

How Big? Host Fast? (CentOS 6.6 Edition)

I didn't do the full breakdown for CentOS, but... It's actually more of a difference. If I measure the difference between -inline-threshold=5000 and default CLang (with -O3 and -fno-fast-math, the defaults, which uses 225 as the inline threshold), I measure about 14% faster.

But that's cheating - the version of CLang available here (3.4.2) is slower than the default GCC on CentOS 6.6. So how about measuring it versus GCC?

Still about 9% faster than GCC.

The CentOS binaries are a bit bigger than MacOS, closer to 8MB than 3MB with debugging info. So the doubling in size makes it bigger, about 18MB instead of 6MB. Beware if you're tight on RAM. But the speedup appears to be true for CentOS, too.

(Measured on recently-updated CentOS 6.6, a Ruby 2.4.0 prerelease, CLang 3.4.2 vs GCC 4.47. YMMV, for all sorts of reasons.)

Disclaimers

So: can you just make Ruby 10% faster? Only if you're CPU-bound. Which you probably aren't.

I'm measuring versus optcarrot, which is intentionally all about CPU calculations in Ruby. "Normal" Ruby apps, like Rails apps, tend to waiting on the OS, or the database, or the network, or...

Nothing you can do to Ruby will speed up the OS, the database or the network by much.

But if you're waiting on Ruby, this can help.

Did Somebody Do It For Me?

Wondering if this got picked up in mainline Ruby, or otherwise made moot? You can check the flags that your current Ruby was compiled with easily:

ruby -r rbconfig -e "puts RbConfig::CONFIG['CFLAGS']"

You're looking for flags like "-O3" (optimization) and "-mllvm -inline-threshold=5000" (to tune inlining.) You can do the same thing with ./tool/runruby inside a built Ruby directory. If you see the inline-threshold flag, somebody has already compiled this into your Ruby.

Conclusion

This option is a great deal if you're on a desktop Mac -- 3MB of RAM for a 7% faster Ruby -- but questionable on a tiny Linux virtual host -- 8MB for 10% faster, but you're probably not CPU-bound.

It is, however, only available with CLang, not with vanilla GCC.

I've opened a bug with a patch to make this behavior default with CLang. Let's see if the Ruby team goes for it! And even if they don't, perhaps ruby-build or RVM will take up the torch. On a modern Mac, this seems like a really useful thing to add.

How do you add it? You need to reconfigure Ruby when building it

Using GPerfTools on MRI Ruby in Mac OS X

There are a lot of great profilers for code that runs in Ruby. There are... fewer really good profilers to work on a standard generated-by-GCC binary, like the Ruby interpreter itself. GPerfTools and Instruments are really your choices, with an honorable mention for DTrace - it isn't a profiler, but it's so flexible that it can do a lot of profiler-like things, including for Ruby.

Today, let's talk about getting GPerfTools working with Ruby - specifically, with "vanilla" Ruby, often called Matz's Ruby Interpreter, or "MRI."

First, download the Ruby source. These days, that can be as simple as git-cloning its GitHub repository. Then you can "autoconf && ./configure && make", which can be enough to get you up and working -- if you don't have OpenSSL problems, anyway.

You'll need GPerfTools, of course. Assuming you use Homebrew, you can install a few useful dependencies like this:

brew install gperftools
brew install graphviz # you'll see why later

You'll also need to build Ruby with the GPerfTools profiling library, and with Address Space Layout Randomization turned off (Mac OS calls its ASLR implementation Position Independent Executables, or PIE.) And it wouldn't be bad to tell it to always use a frame pointer -- marginally slower, but easier to debug at times. That probably looks like this:

export LIBS="-lprofiler"
export cflags="-fno-omit-frame-pointer"
export LDFLAGS="-Wl,-no_pie"
./configure && make clean && make && make check
unset LIBS
unset cflags
unset LDFLAGS

You can also pass -pg in cflags, but that's likely to slow things down a fair bit. (Why those lines? See our post on configuring the Ruby source code for details.)

You might need other things, such as "export PKG_CONFIG_PATH=/usr/local/opt/openssl/lib/pkgconfig:/usr/local/lib/pkgconfig" to configure OpenSSL -- add what you need for your setup as well, naturally.

And now your Ruby should be compatible with GPerfTools. Great! That was a nice short blog post, and now it's cocoa and schnapps all around!

But What Do We Use It For?

We'd like to check against a nontrivial benchmark - the core team often uses a toy Nintendo emulator called optcarrot right now for benchmarking. So let's set that up.

cd .. # Back up one directory from your Ruby source
git clone git@github.com:mame/optcarrot.git
cd optcarrot
ruby bin/optcarrot --benchmark examples/Lan_Master.nes

I see output like this when I run it:

fps: 34.313312258259884
checksum: 59662

So: now we have a thing to profile. How do we profile it?

What Next?

How do we use it? And what if something went wrong?

First, let's try to generate some profiling data. Profilers are quite picky about knowing what program generated the data, so you're much better off running the Ruby interpreter directly. That's a problem if you have a local built Ruby, not installed, and you'd otherwise run it with a script like runruby.

With trial and error, you can figure out which environment variables to set to run Ruby, from the Ruby dir, with GPerfTools active, running optcarrot. You cloned Ruby and optcarrot into two directories next to each other, so optcarrot is at "../optcarrot" for me. Here's the command I use when I run it:

PATH=.:/usr/local/bin:/usr/bin:/bin:/usr/sbin:/sbin RUBYLIB=.:.ext/common:.ext/x86_64-darwin15:lib CPUPROFILE=/tmp/prof.out ./ruby ../optcarrot/bin/optcarrot --benchmark ../optcarrot/examples/Lan_Master.nes

Note the "CPUPROFILE" variable toward the end - that turns on GPerfTools profiling and tells it what file to write to. In this case, I chose "/tmp/prof.out".

Troubleshooting: if Ruby can't find its libraries, you'll need to change PATH and RUBYLIB. If you're not sure what to change them to, change your runruby script near the end, line 105 for me, and "STDERR.puts ENV.inspect" to see what your environment variables should look like. You can run optcarrot with runruby to see what it uses ("./tool/runruby.rb ../optcarrot/bin/optcarrot --benchmark ../optcarrot/examples/Lan_Master.nes") Then, put in your variables instead of mine from the ones you printed to the console.

If you run optcarrot and a /tmp/prof.out file appears... You win! Now you have profiling data. You can move on to "Seeing the Results" below.

More troubleshooting: if it doesn't work, you may want to clean your Ruby directory and rebuild:

git clean -dxf
export LIBS="-lprofiler"
export LDFLAGS="-Wl,-no_pie"
autoconf && ./configure && make clean && make && make check
unset LIBS
unset LDFLAGS

The "git clean" line means "destroy any files that git didn't put here." It cleans out everything a "make clean" would, but also all caches, logs, configurations... Even the configure script itself. It's the equivalent of blowing away your repo and re-cloning, but with less network traffic.

But it blows away the configure script, so you have to run autoconf to regenerate it, and then you'll get a very slow full rebuild. So only do this if you think you need it.

Seeing the Results

So, that's cool. It's kind of neat seeing the file appear in /tmp/prof.out. But what can we do with it?

We'll use pprof, part of GPerfTools. Fair warning: it's a little rough around the edges. If you use it much, you may find yourself reading its Perl source regularly. Pprof isn't amazing for weird corner cases like "you made a typo in the filename for the profiler output" and other "unlikely" situations. On the plus side, it's simple enough that with just a little Perl know-how, or Ruby know-how and some squinting, you can usually figure out what it's doing.

To run pprof, give it your binary's location, the profiling file, and what kind of output you want. Here's a simple example:

pprof ./ruby /tmp/prof.out --text

That should print out examples of what functions are taking the most time, like this:

The first column is how many samples landed in that function but not others that it called. The second column is what percentage of CPU time was spent on that function but not any other functions it called. The third column is a running sum - the total percentage of CPU time that's accounted for by this function and all the ones above it in this sort order (see how it always goes upward on every line?) The fourth and fifth columns are cumulative -- that is, the samples and percent of CPU time used by this function, plus everything else that it called.

The fifth-column percentages don't even vaguely add to 100% - they're cumulative, so they include that function and everything under it. Since vm_exec_core does a lot of calling rby_ary_push, for instance, they wind up with significantly more than 100% of total CPU time between them, because the shared time is double-counted.

(And obviously, last on the line comes the function that's being called, or a big hex number like "0x00007fff9b5eb273" if pprof can't figure out what was getting called there. You won't usually see static functions here, but that's because they're usually inlined -- their addresses are similar to normal function addresses and don't start with 0x000007fff. Addresses starting with that prefix seem to be on the stack. Perhaps the EIP register or ESP register are being used for something else briefly, which seems like it would confuse GPerfTools method of sampling.)

Troubleshooting

If you see only hexadecimal numbers instead of names, you're either not getting debugging symbols, or you didn't turn off PIE (see above.) You'll need to rebuild Ruby, possibly clean from nothing.

This is what that failure looks like:

Think it might be a problem with debug symbols in your Ruby binary? Pprof just uses "nm" for that, so run "nm ./ruby". If you see a bunch of function names, your Ruby binary is fine. Here's what that looks like:

More Fun Output Formats

Pprof can output graphical call graphs. They're fun, but I personally find them a bit impractical. But if you'd like to see and you installed Graphviz via homebrew above... Go ahead and run the same thing, but with "--web" instead of "--text".

pprof ./ruby /tmp/prof.out --web

This should create a nice svg file, also in /tmp, and open Safari to view it (see below.) If instead you got a warning about not having "dot" installed, that means Graphviz wasn't installed, or isn't in your path.

In fact, go ahead and run pprof --help and look at all the output types. I'll wait.

In general, pprof can output line numbers for call sites... But mostly, it doesn't do that on Mac, which lacks the addr2line command-line utility. If I can get gaddr2line working, perhaps you'll get another blog post on it. So: if you get question marks instead of line numbers from the Ruby source code, that's expected.

Play around with pprof - this is all poorly documented, but the trial and error is pretty good.

What Does All This Tell Me?

This should nicely break down where Ruby is spending its time. It's a sampling profiler, so the accuracy is pretty good. If you remember profiling optcarrot before, the output above should make sense -- optcarrot spent its time calling array appends, and Ruby is spending its time on rb_ary_push.

From here on out, you should be able to use this and figure out what Ruby's doing.

And that's what we both wanted, right?


Configuring the Ruby Source Code for Profiling... And Everything Else

I'll be talking a fair bit about configuring the Ruby source code... And I'll show you how to do it as well. With luck, by the end of this post we'll be able to do lots of profiling, setting Ruby code options and whatnot.

A lot of this was occasioned by me trying to use GPerfTools and Instruments... Which turn out to need some configuring.

(This post is basically for Unix, Mac and environments that are set up the same way like MinGW. If you're using an IDE and/or Visual Studio tools, it's probably not going to be a perfect match for you. And if you already know C, Make and Configure really well, and you already have a pretty good idea how the Ruby source code gets configured... You may not learn much here, but please feel free to critique in the comments below!)

The Basics

If you're a Ruby programmer, you may not use C libraries very often. They can be painful. A big C project such as the Ruby interpreter (which is written in C) does a huge amount of checking what's available on your platform, what compiler options and flags are available, what functions are available in what libraries and hundreds or thousands of other things... I wrote about the problems with just OpenSSL (only one of those libraries) not long ago.

The way C solves this is with a long list of possible options, flags and dependencies. A program called "autoconf" builds a giant bash script called "configure", which builds a Makefile, which allows you to build, test and install Ruby. The fact that autoconf, bash and Make are essentially their own individual languages will probably seem barbaric if you're a Rubyist. But this all started so long ago that, um... Well, okay, we only pretend it ever made sense. And Ruby can't do it in Ruby because first you have to build Ruby. But autoconf/configure/make is available nearly everywhere, and mostly works. Ruby, like most other large C projects, uses this system.

The basic short version of "what do I do?" goes like this:

autoconf # if there's no configure script in the current dir
./configure# with options, sometimes
make # build the software
make check # sometimes called "make test" or similar
make install # to copy the program into place

This means that when you want to change how Ruby is built, you may need to change things during configuration, or during make, by setting environment variables for various things... It can be complicated. So let's talk about how that happens.

Command Line Arguments

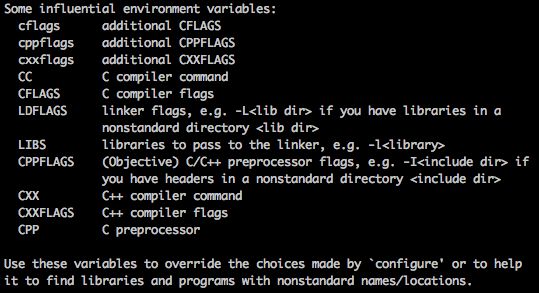
The configure script takes a bunch of command line arguments. Some configure scripts use them for turning features on and off -- Ruby does a little of that, too. But it's not a coincidence that I didn't mention configure scripts when talking about fixing OpenSSL. You can use them to do a few things, though. Here are some chunks of the output of "./configure --help":

If this seems cryptic... You're not alone. It can be hard to figure out how to set an option. So let's talk about some Ruby-relevant ways to do that.

Compiling and Linking

When you build a C program, there are (usually) two passes. The basic C source files get compiled from a .c file into a .o file, called an "object file", which is an intermediate not-yet-runnable chunk of binary code. You can make an object file (or many of them) runnable by putting those pieces together into a single binary with a tool called a linker.

Or you can give the compiler the names of all your .c files originally (not just one,) and it will automatically compile them behind the scenes and run the linker for you. That's good too.

Most project do some of each -- building one .c at a time, or putting them all together in one command. Which means that the configure-and-Make stuff above needs to know which flags get used in which ways, because it needs to pass compiler flags or linker flags, but not the other kind. So we'll talk about several kinds of flags... And the difference between them is basically "compiler, linker or both?"

If you're trying to use a language feature, OS tweak or library that you found online, you'll need to know which type of flag it is. Sometimes you don't know and you have to use trial and error.

Here are some example types of flag, which I also got from "./configure --help":

Compiler Flags

The basic compiler flags, the ones that aren't meant for the linker, go into an environment variable called CFLAGS. There's a sort of "extra CFLAGS" variable to Ruby's configure called "cflags." Yeah, they're different :-/ I recommend exporting the cflags variable before you run configure, which should add the flags you want.

For instance, want to add profiler information with the "-pg" compiler flag? You could do this:

export cflags="-pg"
./configure && make clean && make# build Ruby
unset cflags # Don't leave this sitting around

If you set CFLAGS instead of cflags, it'll replace the set Ruby uses instead of adding to them. You probably don't want to do that, since they include a lot of debugging information, compiler warnings and optimization flags that you probably don't want to lose.

Sometimes, Ruby already uses a given flag. It can be bad if you add a flag that conflicts with something Ruby already uses. So there are some Ruby-specific additional variables such as "debugflags" for specific kinds of compiler flags. Unfortunately, you may just need to read the configure source code (see "configure.in" in the Ruby source) to find these... The example below is to set a compiler flag for debugging information manually. Otherwise, Ruby would do it for you. And if you put it into cflags, you and Ruby would both do it, which comes out badly.

(You could also figure out what goes in CFLAGS and replace what Ruby would put there. If so, caveat emptor!)

export debugflags="-g3"
./configure && make clean && make
unset debugflags

Similar option types include optflags for optimization and warnflags for code warnings.

Linker Flags

We mentioned that some flags get sent to the linker, not the C compiler. For instance, MacOS has Address Space Layout Randomization (MacOS uses a variant called "PIE," for Position-Independent Executable.) This feature can make it very hard to debug or profile, because all the functions move around.

But you can turn it off with a linker flag, "-no_pie". And you can tell the compiler to pass that linker flag through with "-Wl,-no_pie" since there's no compiler flag for it. That compiler option means roughly: pass the following "-no_pie" to the linker without trying to make any sense of it.

You do the same as above, but pass it in LDFLAGS instead of CFLAGS so that Ruby will use it whenever it's invoking the linker:

export LDFLAGS="-Wl,-no_pie"
./configure && make clean && make
unset LDFLAGS

Library Flags

Sometimes you want to add in a library, one that Ruby otherwise wouldn't use. I'll use the example of GPerfTools' profiling library, because hey, I have a nice "how to profile" theme going here.

export LIBS="-lprofiler"
./configure && make clean && make
unset LIBS

This can also be used with a "-L /path/to/files" (capital L, not lowercase l) to make Ruby look for existing libraries in new places. This will get passed to the compiler, but not when just making an object file -- only when it creates a binary.

About That Title

If you want to profile with GPerfTools or Instruments, you'll need to use the option above to turn off PIE. If you want to profile with GPerfTools specifically, you'll need the "-lprofiler" option. So here's the "TL;DR" version of this article:

export LDFLAGS="-Wl,-no_pie"
export LIBS="-lprofiler"
autoconf && ./configure && make clean && make
unset LIBS
unset LDFLAGS

You may need to "brew install autoconf" or the equivalent as well. And you already have XCode, right? And... Well, let's say that having a full set of C development tools is another whole blog post, if you haven't done it already.

But What If...?

Naturally I haven't discussed every possible configuration option here. The next time you'd like to remember how amazing it is to just work in Ruby, I recommend configuring a big C project of any description. But in case you need it, here are some places you can look for Ruby knobs and levers to fiddle with, roughly in the order to check:

  • Just Google your problem
  • Arguments to ./configure
  • One of the environment variables above
  • Google your problem again, with what you learned
  • Check the Makefile
  • Check the source to ./configure
  • Google your problem one more time
  • Dive into the Ruby source

Happy Rubying!


Configuring Ruby on MacOS with OpenSSL

If you, like me, use MacOS and Homebrew, you may have had some trouble configuring Ruby from source - and maybe even more if you don't use Homebrew. You may also have gotten some odd error messages when you tried. I had some trouble on El Capitan, but a quick Google search will find many weird errors with OpenSSL and Ruby over many years and many versions. RVM goes so far as to download its own OpenSSL and link against it when it builds.

Of course, that doesn't help you if you're building from source, without using RVM.

How Do You Check?

First off, let's talk about how you see if you have openssl working. You *can* run "make check" in your Ruby source directory, but that's quite slow. Better is to start up irb and require "openssl". If Ruby can't find it, that means it didn't get built -- or your path is wrong. You can require something else to make sure it's not a path problem.

$ irb
2.3.1 :001 > require "tsort"
 => true
2.3.1 :002 > require "openssl"
 => true

(I required "tsort" just as a way of showing that, yes, my standard Ruby libraries were available.)

You can also cut that down to a one-liner by having Ruby evaluate code from the command line:

$ ruby -r openssl -e 'print "Working\n"'
Working
$

Okay, maybe I just really like one-liners :-)

What If It Doesn't Work?

Extensions don't always rebuild properly if Ruby can't detect the libraries. Specifically, configure doesn't always seem to figure out when it's been looking in the wrong place. So just re-making will often not rebuild Ruby's OpenSSL extension properly if it didn't get detected right the first time. This will manifest as a C error about incompatible prototypes for HMAC_CTX_copy, a function you've rightly never heard of and don't care about. That's because Ruby is using a very old, slightly wrong version of this function in its chunk of "you don't have OpenSSL" stub code.

You can track this down to a few old commits in 2008 (commit a8a111 in Ruby GitHub, and commit 87d524 in OpenSSL, not that I checked or anything.) But if you're getting prototypes not matching on HMAC_CTX_copy, it's because Ruby has the OpenSSL extension half-configured. Kill it with fire. If you're cloned from the Ruby GitHub repo, that looks like this in your Ruby source directory:

git clean -dxf
autoconf
./configure
make
make check

That first incantation, "git clean -dxf" means "destroy every file that wouldn't be there after a new clean git checkout." Even stuff in .gitignore. If Git didn't put it there, destroy it. If you wonder if your local Ruby checkout might be in an inconsistent state, I recommend that command highly. Of course, you'll also wait quite awhile for everything to be configured and built.

However, that will make sure you're seeing the OpenSSL that's actually available on your system instead of one that configure saw and cached several versions ago.

(Is it a problem that Ruby has some of the wrong prototypes for OpenSSL functions in its "you don't have OpenSSL" stub? Not really. They're very close. And you'll only see the compiler complain if you pull in both sets, which is an error, and a sign that things are already wrong. It's actually kind of nice, because you never wind up with a compiled-but-half-functioning Ruby with part stubs and part real OpenSSL.)

Any Hints on Why?

OpenSSL is one of a number of Ruby "extensions" which get compiled along with your Ruby. Ruby will try to build them, but may not if it can't find needed libraries, or if something fails when Ruby tries to compile it.

These extensions live in your Ruby source tree under the "ext" directory:

There may be a "mkmf.log" directory in any of them -- especially if something failed to build. You can see how the extensions above may not be around if something they need isn't there (Win32ole on a Mac, say, or zlib or openssl on a computer without those libraries installed.)

If you're basically C-literate, the mkmf.log file may be able to tell you that it can't find the library, or that there's an incompatibility. May I recommend not digging too deep in those cases unless you know OpenSSL quite well? That way, madness lies. Still, opening up mkmf.log and reading the last few entries can sometimes be quite useful ("wait, it's finding what version of OpenSSL? In what directory? Why is that there?")

It's possible to rebuild just the OpenSSL extension instead of all of Ruby as a way to see if you got the configuration right. I recommend not doing that. It's easy to wind up with a half-configured setup, some stuff cached by configure and passed in, and otherwise something that only sort-of works, and which you'll never be able to replicate if you ever need to build Ruby again. When possible, build clean and from the top level, even if it's slower, so that you'll be able to do it again later if you need to.

Homebrew? From Source?

I did a fair bit of uninstalling and reinstalling openssl in Homebrew, and from source. As it turns out, that wasn't my problem here. But in case you need it:

$ brew uninstall openssl

# And in the OpenSSL source directory:

./config --prefix=/usr/local --openssldir=/usr/local/openssl
./Configure darwin64-x86_64-cc
make depend
make
make test
make install
cd /usr/local/include && ln -s /usr/local/ssl/include/openssl .


What If It Still Doesn't Work?

Ruby can be picky on a Mac about picking up OpenSSL, which uses a slightly funky directory structure for a library anyway. I tried a bunch of things with setting LIBS when configuring, to no avail.

It turns out there's a utility already on your Mac that Ruby will use and that specializes in this sort of thing: pkg-config.

There's a nice blog post that explains how this works, but the sort answer looks like this:

export PKG_CONFIG_PATH=/usr/local/opt/openssl/lib/pkgconfig:/usr/local/lib/pkgconfig

By telling pkg-config exactly where to find OpenSSL and to look there first, Ruby finds it, and everything works... Almost.

You should put that in your ~/.bashrc file, so that it always happens. That way, next time you build Ruby it will just "magically work," instead of you having to remember where you read this blog post.

And When My Tests Fail?

All of that gets you almost all the way there. But when you run all the Ruby tests, such as with "make check", four will fail with timeouts on incoming network connections. And, if you're lucky, you'll get a little pop-up window telling you that Mac OS isn't so sure that your process should just get to open incoming sockets. Security!

Mac comes with something called Mac Application Firewall, which will cause some of Ruby's OpenSSL tests to fail, if you have it on.

Short answer: go to the "Security and Privacy" control panel, to the "Firewall" tab, and turn it off. You'll need to open the little lock icon at the bottom to make changes, just like always.

However, now it should be working!

What If It's Still Not Working?

I can only tell you what worked for me. But here are a few more possibilities that didn't help me, but might help you.

You can uninstall and reinstall OpenSSL via Homebrew. This will help if your version is damaged.

You can install a new OpenSSL from source, with the commands above. This will help if you're using the wrong version.

You can install Ruby via RVM. Remember that "rvm install ruby-head" will grab the latest, so you're not limited to released, stable versions. RVM has a lot of workarounds to get Ruby compiled with OpenSSL and downloads and configures its own, so it's often the easiest. Also, even if your local system OpenSSL is broken somehow, RVM won't be using it, so that may be a workaround for that problem. Ruby-build can also work for this.

You can install OpenSSL to a different directory. In the "configure OpenSSL from source" commands above, I put it under /usr/local. But you can put it directly under /usr, for instance, or otherwise try a place that might be easier to find.

Final Thoughts

If you can, install via RVM or ruby-build to avoid doing this yourself.

If you need latest source, but not often, still use rvm or ruby-build.

If you need to build locally, have pkg-config do the configuration, don't do it yourself.

If you still have to configure it yourself, make sure to "git clean -dxf" to avoid even the slightest chance of a half-cached older configuration.

If you'll need to build Ruby again, put the "export PKG_CONFIG_PATH=/usr/local/opt/openssl/lib/pkgconfig:/usr/local/lib/pkgconfig" into your ~/.bashrc file so it happens always, not just this one time.

In short, Ruby's code is part of the C ecosystem, with all the usual library-based problems that entails. If somebody else can do part of the configuration work for you, please let them :-)


A Little Ruby-Land Profiling with StackProf

I'm looking at Ruby performance lately. Aaron Patterson was awesome when I asked him about Ruby performance and his interview -- he pointed me at a great but Linux-specific Japanese blog post about how to profile Ruby itself. The program being used, called optcarrot, is a headless NES emulator that the Ruby core team are using as a CPU-intensive optimization target. Thus "optcarrot" == "optimization carrot", the target they're trying to optimize. Cute, right?

I'm on a Mac, which seems to lack most profiling tools (e.g. no gprof) and the existing one or two like XCode's Instruments seem fairly command-line-unfriendly and Makefile-unfriendly. But while I learn to use DTrace for profiling and get a Linux VM set up with other profiling tools, I can also check out the Ruby-side performance. Let's talk about that.

(One confusing point: there's the performance of the Ruby interpreter itself, and then the performance of the Ruby code running in the interpreter. Today's post is about the code running in the interpreter. So the function names and durations are from the optcarrot NES emulator, not the internals of the core Ruby language - yet. Capisce?)

The beginning of that Japanese post mentions stackprof, which I hadn't used before. I'm enjoying it more than perftools.rb or ruby-prof, and it's been much easier to set up. Let's talk about how to use it.

I got stackprof set up in a locally-compiled development Ruby. I'm not going to say too much about that here - it's kind of painful, and I don't recommend it without a good reason. So maybe I'll post about it later. Today, let's just talk about what stackprof shows us about optcarrot.

Stackprof needs to be in the local ruby, so "gem install stackprof" to make that happen. You may need to put it into a Gemfile with "gem stackprof" -- I did that in optcarrot. Then it wants to be required and configured. In optcarrot, you can do that in the bin/optcarrot file. Here's the original file:

#!/usr/bin/env ruby

# I'm too lazy to type `-Ilib` every time...
require_relative "../lib/optcarrot"

Optcarrot::NES.new.run

end

And here's the version with stackprof. Pretty simple:

#!/usr/bin/env ruby

require 'stackprof'# added

StackProf.run mode: :cpu, # added
interval: 1000,
out: '/tmp/stackprof_optcarrot.dump' do

# I'm too lazy to type `-Ilib` every time...
require_relative "../lib/optcarrot"

Optcarrot::NES.new.run

end

Okay. So what's it do? Well, run optcarrot again, just like before... If you're not running a funky local Ruby, that's probably just "ruby bin/optcarrot --benchmark examples/Lan_Master.nes". If you need to instead add a bunch of non-standard includes and stuff so that Ruby can find its local standard library, you have my sympathies :-)

Once the run works, you should see the file that's listed in the StackProf.run line. I used /tmp/stackprof_optcarrot.dump as the filename, but you can pick what you like.

$ ls -l /tmp
total 2272
drwx------3 noah.gibbswheel102 May 31 16:35 com.apple.launchd.5JyKIrJXHi
drwx------3 _mbsetupuserwheel102 May 31 16:35 com.apple.launchd.6AV1lzEddb
drwx------3 _mbsetupuserwheel102 May 31 16:35 com.apple.launchd.RhIpa252Cv
drwx------3 noah.gibbswheel102 May 31 16:35 com.apple.launchd.yH43wuq7kM
-rw-r--r--1 noah.gibbswheel10236 Jun9 15:12 stackprof_optcarrot.dump

What do you do with it?

The most useful is to ask it what used most of the performance:

$ stackprof /tmp/stackprof_optcarrot.dump --text --limit 10
==================================
Mode: cpu(1000)
Samples: 3625 (1.01% miss rate)
GC: 10 (0.28%)
==================================
 TOTAL(pct) SAMPLES(pct) FRAME
2854(78.7%)2854(78.7%) Optcarrot::PPU#render_pixel
 271 (7.5%) 271 (7.5%) block (3 levels) in <class:PPU>
 218 (6.0%) 109 (3.0%) Optcarrot::PPU#setup_lut
79 (2.2%)79 (2.2%) Optcarrot::PPU#setup_frame
55 (1.5%)55 (1.5%) Optcarrot::CPU#fetch
26 (0.7%)26 (0.7%) Optcarrot::PPU#wait_one_clock
19 (0.5%)19 (0.5%) Optcarrot::PPU#update_address_line
6017 (166.0%)14 (0.4%) Optcarrot::PPU#main_loop
13 (0.4%)13 (0.4%) Optcarrot::PPU#evaluate_sprites_even
13 (0.4%)13 (0.4%) Optcarrot::PPU#load_tiles

Stackprof will also output files, graphviz output, flamegraphs, specific methods and more. See its GitHub page for more details.

So - what does that actually tell us? The PPU code is the "graphical" output (headless in this case) where it calculates all the output pixels. Optcarrot's documentation (see doc/benchmark.md) even warns us that the vast majority of the time will be spent in PPU#run and CPU#run. That makes a lot of sense for a game console emulator. The time is spent emulating the hardware.

The render_pixel function isn't terribly long (see lib/optcarrot/ppu.rb and search for "render_pixel"). But looking at that array append at the end, I had a sudden suspicion. I tried just commenting out that one last line of the function (yes, the emulator is useless at that point, but humor me.) Delete /tmp/stackprof_optcarrot.dump, run the emulator, run stackprof again and...

$ stackprof /tmp/stackprof_optcarrot.dump --text --limit 10
==================================
Mode: cpu(1000)
Samples: 2753 (1.18% miss rate)
GC: 14 (0.51%)
==================================
 TOTAL(pct) SAMPLES(pct) FRAME
 495(18.0%) 493(17.9%) Optcarrot::PPU#vsync
 259 (9.4%) 259 (9.4%) block (3 levels) in <class:PPU>
 258 (9.4%) 258 (9.4%) Optcarrot::PPU#render_pixel
 202 (7.3%) 202 (7.3%) Optcarrot::PPU#wait_one_clock
 137 (5.0%) 135 (4.9%) Optcarrot::CPU#fetch
 119 (4.3%) 119 (4.3%) Optcarrot::PPU#update_address_line
 113 (4.1%) 113 (4.1%) Optcarrot::PPU#evaluate_sprites_even
 110 (4.0%) 110 (4.0%) Optcarrot::PPU#setup_frame
 203 (7.4%) 101 (3.7%) Optcarrot::PPU#setup_lut
2786 (101.2%)98 (3.6%) Optcarrot::PPU#main_loop

Instead of 78% of the total runtime, render_pixel is down to 9.4% of the total runtime. So that array append is burning a great big chunk of our CPU cycles.

You can also verify this by asking stackprof to "zoom in" on the render_pixel method.

$ stackprof /tmp/stackprof_optcarrot.dump --text --method render_pixel

See the left columns? That single line is using 75.2% of the total runtime. So again, the array append is slow...

If I were trying to optimize the optcarrot NES emulator, I'd restructure that -- preallocate the array, so there's only one memory allocation? Don't use an array at all, and find some other way to handle pixel output?

But I'm not really trying to optimize optcarrot. Instead, I'm trying to optimize the Ruby internal operations that make optcarrot slow. And now I know -- those are dominated by arrays.

By the way - don't take the one-line-commented-out op count too seriously. That's dominated by PPU#vsync, but PPU#vsync winds up blacking the screen if render_pixel doesn't write output pixels. And that's an array append in a tight loop. In other words, if you take out the slow array appends in render_pixel, it will fill in with a bunch more array appends anyway. This is one of the hazards of modifying the code you're profiling - it changes the behavior.

In a later post, perhaps we'll return to that array append. I'm still figuring out how to optimize it. I suspect realloc() being slow, myself. And in the mean time, you have learned a bit about how to use stackprof, which is a pretty darned awesome tool.


Git Bisect to Find a Ruby Regression

Hi! My name is Noah. I'm AppFolio's new Ruby Fellow. Though I've been working on Ruby stuff for a long time, most of it hasn't been on the core Ruby language.

So: that means I'm getting up to speed. And I'm a compulsive blogger. So you'll get a series of posts about how to do interesting things with the Ruby code, and how to get started with it.

Today I'm looking at a minor regression in Ruby, and using git-bisect to find it. Care to follow along?

(@nalsh on Twitter points out that you can use tool/bisect.sh in the Ruby source if you're bisecting on a test that Ruby already has. It's even easier!)

I have the Ruby code checked out locally. I'm running the bug-reporter's example test, an "nth prime" example from Exercism.io. It succeeds on Ruby 2.2, and fails with an obscure "deadlock; recursive locking" error on the very latest Ruby (currently 2.4, commit d16ff5 in the GitHub mirror.)

To check if a given Ruby version is good or bad, I'm rebuilding Ruby and running the test via this incantation: "make && ./ruby -v -Ilib -I. -I.ext/x86\_64-darwin15 ~/Desktop/nth_prime_test.rb". The extra arguments are to use local libraries from the Ruby build directory on my Macbook. It'll be a little different if you're using Windows or Linux.

(Here's a time-saver of a tip: check your incantation by manually switching back and forth between the first "good" and "bad" revisions - that way you'll be sure that you're rebuilding the right things to get the bug after you weren't getting it, and vice-versa. That's very important when you're trying to isolate it. And checking all the revisions when your test doesn't work will waste your time.)

I started my "git bisect" on Ruby's git history:

$ git bisect start trunk # Trunk is bad, current (ruby_2_2) is good
$ make && ./ruby #... # Run the tests
$ git bisect good

After each "git bisect" command I make Ruby locally and run my test again. Then I either type "git bisect good" or "git bisect bad", depending whether I got the nasty deadlock error that I'm tracking down.

 $ git bisect good
Bisecting: a merge base must be tested
[7632a82d5750b7908bd173eda3268ecb0855b934] * gc.c (wmap_final_func): fix memory size shortage when realloc wmap. Fix SEGV during finilize of WeakRef on Solaris (though the SEGV could occur on all OS/platforms). [ruby-dev:48779] [Bug #10646]
$ make && ./ruby #... # Run the tests again

Git bisect, if you don't know it already, will look at the whole list of commits between your "good" and "bad" revision, pick one in the middle, and then let you test it to see if it's "good" or "bad". Each time you tell it, it will cut the range of commits in half again.

So it's a binary search algorithm, but you'll be playing the role of the "compare" operation :-)

If you hit a different bug, you can "git bisect skip" to say that that commit can't be tested... It'll take a little longer to find the bug because you had to rebuild Ruby just to find out that one commit wasn't good. But when you need it, use it. Also, there's always a weird tension about how much you rebuild. Do you "git clean -dxf && autoconf && ./configure &&..." (aka nuke it from orbit and redo everything)? Do you just remake as little as possible? This is one reason that it can be touch to just hand it a script and have it do the right thing, unless your script does a full nuke-and-rebuild, which can be very slow. I'm sure there's also a smart way to not rebuild rdoc every time, but I'm still getting the hang of lots of Ruby rebuilding ;-)

WhoDunnit

Did you read the original bug? Wondering why innocent-looking code having nothing obvious to do with threads is getting a bizarre mutex error with some Ruby versions?

The Mutex exists because the example code uses Prime, which is a Singleton, which locks itself when getting the single, global instance of Prime that exists. The commit that git-bisect finds looks relevant: commit d2487e removes an obsolete Prime.new operation. It also switches Prime to be a Singleton. The old version of Prime used an internal @the_instance variable to track itself. The new ones uses Singleton, and a mutex, and the code where it gets that deadlock error. Ah!

The deadlock error on the mutex basically means "this mutex is already locked by you and you're locking it again" -- which can never succeed. Frequently it's caused by... recursion.

In this case, Prime got rid of its .new() method. The Singleton class, in Ruby, makes its instance using .new(). Worse, the sample code winds up defining .new() as well. So when it calls .new(), Prime winds up calling .instance(), which calls .new(), which calls .instance()...

And so it looks like the problem is just the code in question defining a .new() method. It's technically a regression, but is it one that matters? Hm...

Want to see what happens? Watch the bug for updates!