A Simpler Rails Benchmark, Puma and Concurrency

I’ve been working on a simpler Rails benchmark for Ruby, which I’m calling RSB, for awhile here. I’m very happy with how it’s shaping up. Based on Rails Ruby Bench, I’m guessing it’ll take quite some time before I feel like it’s done, but I’m finding some interesting things with it. And isn’t that what’s important?

Here’s an interesting thing: not every Rails app is equal when it comes to concurrency and threading - not every Rails app wants the same number of threads per process. And it’s not a tiny, subtle difference. It can be quite dramatic.

(Just want to see the graphs? I love graphs. You can scroll down and skip all the explanation. I’m cool with that.)

New Hotness, Old and Busted

You’ll get some real blog posts on RSB soon, but for this week I’m just benchmarking more "Hello, World” routes and measuring Rails overhead. You can think of it as me measuring the “Rails performance tax” - how much it costs you just to use Ruby on Rails for each request your app handles. We know it’s not free, so it’s good to measure how fast it is - and how fast that’s changing as we approach Ruby 3x3 and (we hope) 3x the performance of Ruby 2.0.

For background here, Nate Berkopec, the current reigning expert on speeding up your Rails app, starts with a recommendation of 5 threads/process for most Rails apps.

You may remember that with Rails Ruby Bench, based on the large, complicated Discourse forum software, a large EC2 instance should be run with a lot of processes and threads for maximum throughput (latency is a different question.) There’s a diminishing returns thing happening, but overall RRB benefits from about 10 processes with 6 threads per process (for a total of 60 threads.) Does that seem like a lot to you? It seems like a lot to me.

I’m gonna show you some graphs in a minute, but it turns out that RSB (the new simpler benchmark) actually loses speed if you add very many threads. It very clearly does not benefit from 6 threads per process, and it’s not clear that even 3 is a good idea. With one process and four threads, it is not quite as fast as one process with only one thread.

A Quick Digression on Ruby Threads

So here’s the interesting thing about Ruby threads: CRuby, aka “Matz’s Ruby,” aka MRI has a Global Interpreter Lock, often called the GIL. You’ll see the same idea referred to as a Global VM Lock or GVL in other languages - it’s the same thing.

This means that two different threads in the same process cannot be executing Ruby code at the same time. You have to hold the lock to execute Ruby code, and only one thread in a process can hold the lock at a time.

So then, why would you bother with threads?

The answer is about when your thread does not hold the lock.

Your thread does not hold the lock when it’s waiting for a result from the database. It does not hold the lock when sleeping, waiting on another process finishing, waiting on network I/O, garbage collecting in a background thread, running code in a native (C) extension, waiting for Redis or otherwise not executing Ruby code.

There’s a lot of that in a typical Rails app. The slow part of a well-written Rails app is waiting for network requests, waiting for the database, waiting for C-based libraries like libXML or JSON native extensions, waiting for the user…

Which means threads are useful to a well-written Rails app, even with the GIL, up to around 5 threads per process or so. Potentially it can be even more than 5 — for RRB, 6 is what looked best when I first measured.

But Then, Why…?

Here’s the thing about RSB. It’s a “hello, world” app. It doesn’t use Redis. It doesn’t even use the database. And so it’s doing only a little bit where CRuby threads help, because of the GIL. Only a little HTTP parsing. No JSON or XML parsing.

Puma does a little more that can be parallelized, which is why threads help at all, even a little.

So: Discourse is near the high end of how many threads help your Rails app at around 6. But RSB is just about the lowest possible (2 is often too many.)

Okay. Is that enough conceptual and theoretical? I feel like that’s plenty of conceptual and theoretical. Let’s see some graphs!

Collecting Data

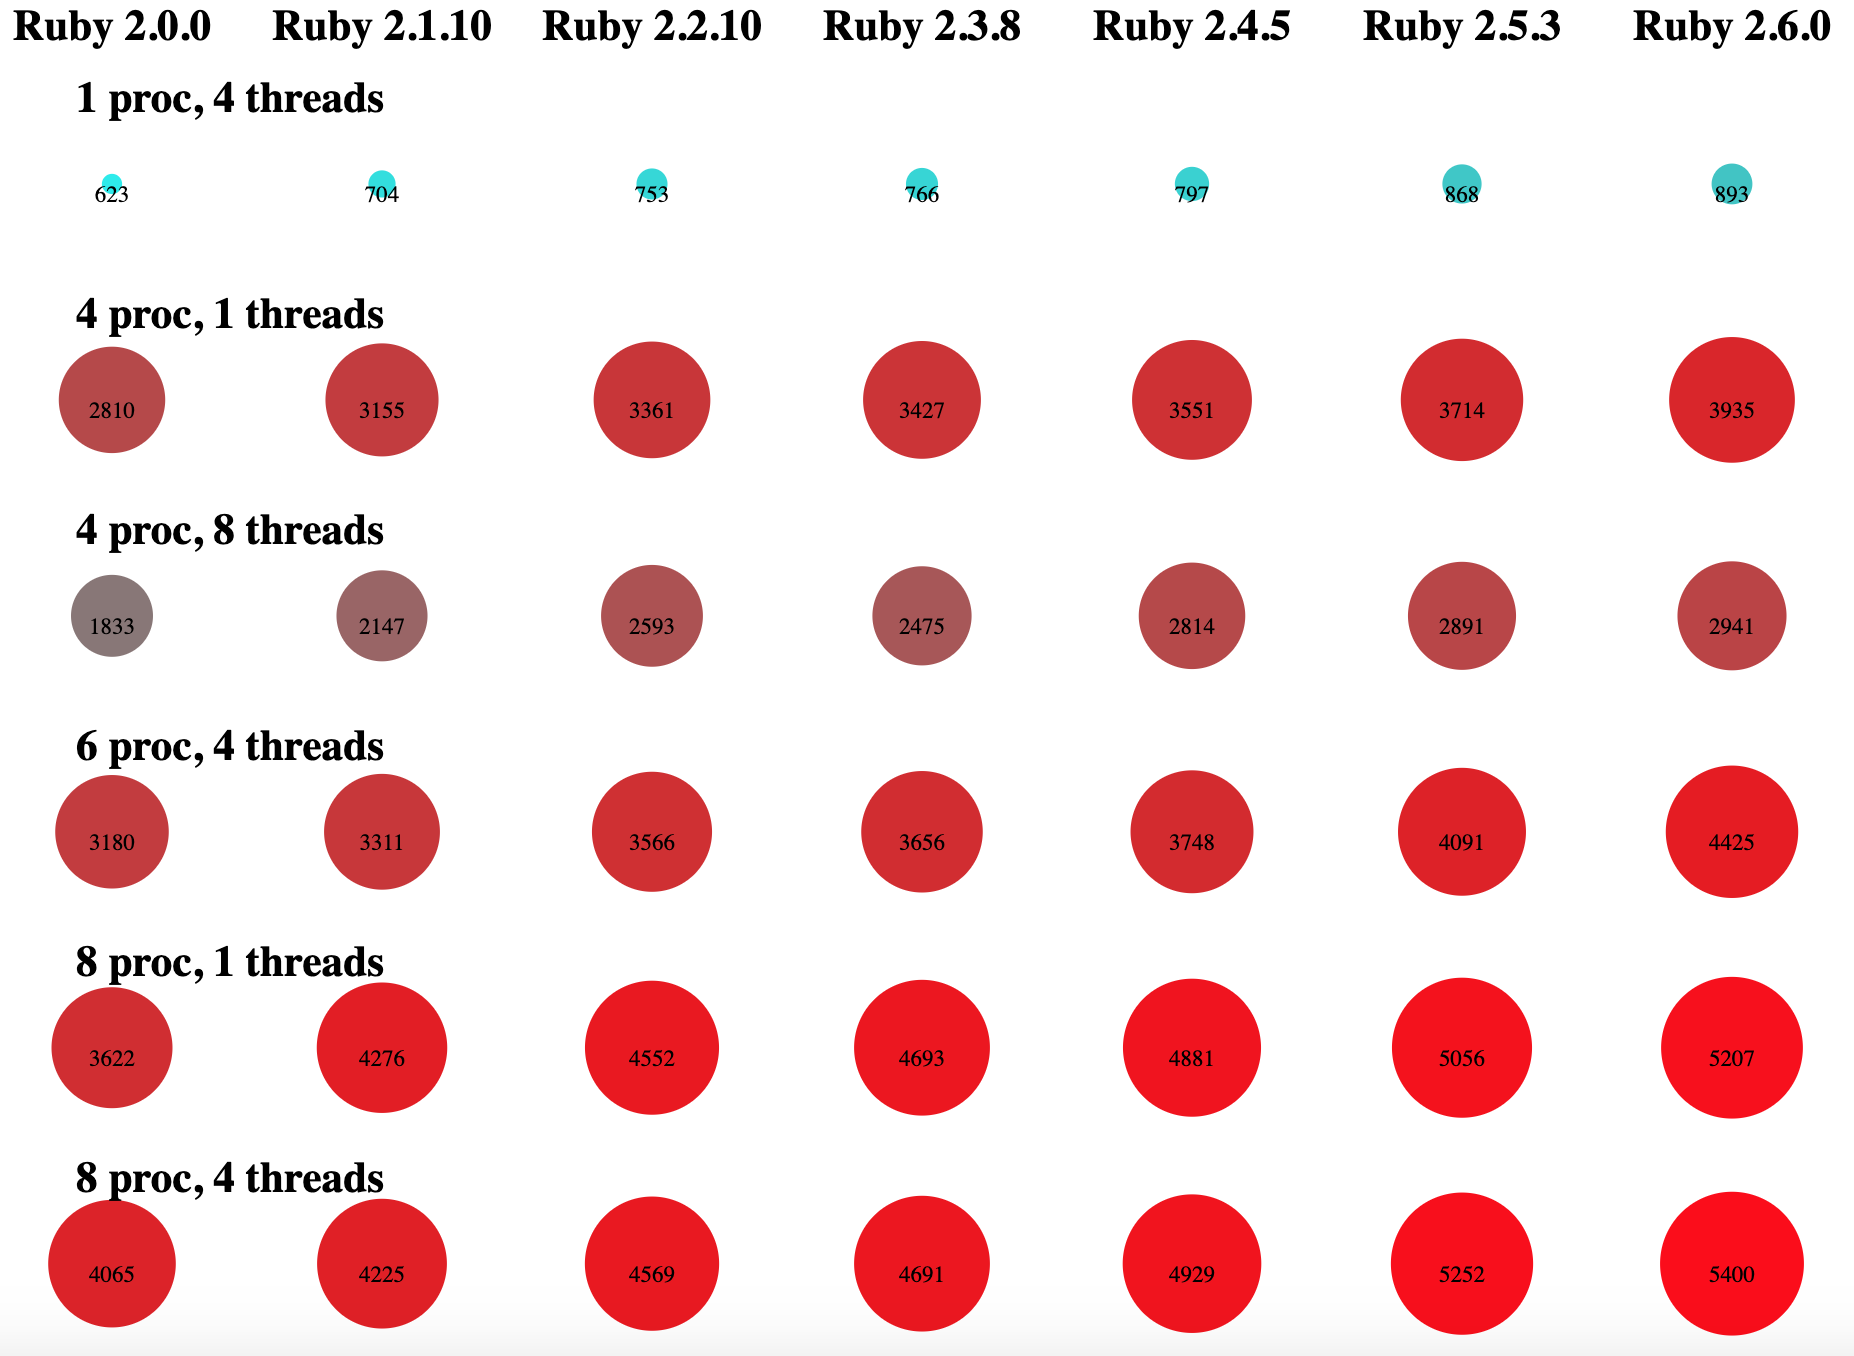
I’ve teased about finding some things out. So what did I do? First off, I picked some settings for RSB and ran them. And in the best traditions of data collection, I discovered a few useful things and a few useless things. Here’s the brief, cryptic version… Followed by some explanation:

multiversion_puma_concurrency.png

Clear as mud, right?

The dots in the left column are for Ruby 2.0.0, then Ruby 2.1.10, 2.2.10, etc., until the rightmost dots are all Ruby 2.6. See how the dots get bigger and redder? That’s to indicate higher throughput — the throughputs are in HTTP requests/second, and are also in text on each dot. Each vertical column of dots uses the same Ruby version.

Each horizontal row of dots uses the same concurrency settings - the same number of processes and threads. You can see a key to how many of each over on the left.

What can we conclude?

First, the dots get bigger from left to right in each row, so Ruby versions gets faster. The “Rails performance tax” gets significantly lower with higher Ruby versions, because they’re faster. That’s good.

Also: newer Ruby versions get faster at about the same rate for each concurrency setting. To say more plainly: different Ruby versions don’t help much more or less with more processes or threads. No matter how many processes or threads, Ruby 2.6.0 is in the general neighborhood of 30% faster than Ruby 2.0.0 - it isn’t 10% faster with one thread and 70% faster with lots of threads, for instance.

(That’s good, because we can measure concurrency experiments for Ruby 2.6 and they’ll mostly be true for 2.0.0 as well. Which saves me many hours on some of my benchmark runs, so that’s nice.)

Now let’s look at some weirder results from that graph. I thought the dots would be clearer for the broad overview. But for the close-in, let’s go back to nice, simple bar graphs.

Weirder Results

Let’s check out the top two rows as bars. Here they are:

The Ruby versions go 2.0 to 2.6, left to right.

The Ruby versions go 2.0 to 2.6, left to right.

What’s weird about that? Well, for starters, 1 process with four threads is less than one-fourth of the speed of 4 processes with one thread. If you’re running single-process, that kinda sounds like “don’t bother with threads.”

(If you already read the long-winded explanation above you know it’s not that simple, and it’s because RSB threads really poorly in an environment with a Global Interpreter Lock. If you didn’t — it’s a benchmark! Feel free to quote this article out of context anywhere you like, as long as you link back here :-) )

Here’s that same idea with another pair of rows:

Kinda looks like “just save your threads and stay home,” doesn’t it?

Kinda looks like “just save your threads and stay home,” doesn’t it?

It tells the same story even more clearly, I think. But wait! Let’s look at 8 processes.

The Triumphant hero shot: a case where 4 threads are… well, maybe marginally better than 1. Barely. Also, this was the final graph. You can CMD-W any time from here on out.

The Triumphant hero shot: a case where 4 threads are… well, maybe marginally better than 1. Barely.
Also, this was the final graph. You can CMD-W any time from here on out.

That’s a case where 4 threads per process give about a 10% improvement over just one. That’s only noteworthy because… well, because with fewer processes they did more harm than good. I think what you’re seeing here is that with 8 processes, you’re finally seeing enough not-in-Ruby I/O and context switching that there’s something for the extra threads to do. So in this case, it’s really all about the Puma configuration.

I am not saying that more threads never help. Remember, they did with Rails Ruby Bench! And in fact, I’m looking forward to finding out what these numbers look like when I benchmark a Rails route with some real calculation in it (probably even worse) or a few quick database accesses (probably much better.)

You might reasonably ask, “why is Ruby 2.6 only 30% faster than Ruby 2.0?” I’m still working on that question. But I suspect part of the answer is that Puma, which is effectively a lot of what I’m speed-testing, uses a lot of C code, and a lot of heavily-tuned code that may not benefit as much from various Ruby optimizations… It’s also possible that I’m doing something wrong in measuring. I plan to continue working on it.

How Do I Measure?

First off, this is new benchmark code. And I’m definitely still shaking out bugs and adding features, no question. I’m just sharing interesting results while I do it.

But! The short version is that I set up a nice environment for testing with a script - it runs the trials in a randomized order, which helps to reduce some kinds of sampling error from transient noise. I use a load-tester called wrk, which is recommended by the Phusion folks and generally quite good - I examined a number of load testers, and it’s been by far my favorite.

I’m running on an m4.2xlarge dedicated EC2 instance, and generally using my same techniques from Rails Ruby Bench where they make sense — a very similar data format, for instance, to reuse most of my data processing code, and careful tagging of environment variables and benchmark settings so I don’t get them confused. I’m also recording error rates and variance (which effectively includes standard deviation) for all my measurements - that’s often a way to find out that I’ve made a mistake in setting up my experiments.

It’s too early to say “no mistakes,” always. But I can set up the code to catch mistakes I know I can make.

I’d love for you to look over the benchmark code and the data and visualizations I’m using.

Conclusions

It’s tempting to draw broad conclusions from narrow data - though do keep in mind that this is pretty new benchmark code, and there could be flat-out mistakes lurking here.

However, here’s a pretty safe conclusion:

Just because “most Rails apps” benefit from around five threads/process doesn’t mean your Rails or Ruby app will. If you’re mostly just calculating in Ruby, you may want significantly fewer. If you’re doing a lot of matching up database and network results, you may benefit from significantly more.

And you can look forward to a lot more work on this benchmark in days to come. I don’t always publicize my screwed up dubious-quality results much… But as time marches forward, RSB will keep teaching me new things and I’ll share them. Rails Ruby Bench certainly has!

WRK It! My Experiences Load-Testing with an Interesting New Tool

There are a number of load-testers out there. ApacheBench, aka AB, is probably the best known, though it’s pretty wildly inaccurate and not recommended these days.

I’m going to skim quickly over the tools I didn’t use, then describe some interesting quirks of wrk, good and bad.

Various Other Entrants

There are a lot of load-testing tools and I’ll mention a couple briefly, and why I didn’t choose them.

For background, “ephemeral port exhaustion” is what happens when a load tester keeps opening up new local sockets until all the ephemeral range are gone. It’s bad and it prevents long load tests. That will become relevant in a minute.

Siege uses a cute dog logo, though.

Siege uses a cute dog logo, though.

ApacheBench, as mentioned above, is all-around bad. Buggy, inexact, hard to use. I wrote a whole blog post about why to skip it, and I’m not the only one to notice. Nope.

Siege isn’t bad… But it automatically reopens sockets and has unexplained comments saying not to use keepalive. So a long and/or concurrent and/or fast load test is going to hit ephemeral port exhaustion very rapidly. Also, siege doesn’t have an easy way to dump higher-resolution request data, just the single throughput rate. Nope.

JMeter has the same problem in its default configuration, though you can ask it not to. But I’m using this from the command line and/or from Ruby. There’s a gem to make this less horrible, but the experience is still quite bad - JMeter’s not particularly command-line friendly. And it’s really not easy to script if you’re not using Java. Next.

Locust is a nice low-overhead testing tool, and it has a fair bit of charm. Unfortunately, it really wants to be driven from a web console, and to run across many nodes and/or processes, and to do a slow speedup on start. For my command-line-driven use case where I want a nice linear number of load-test connections, it just wasn’t the right fit.

This isn’t anything like all the available load-testing tools. But those are the ones I looked into pretty seriously… before I chose wrk instead.

Good and Bad Points of Wrk

Nearly every tool has something good going for it. Every tool has problems. What are wrk’s?

First, the annoying bits:

1) wrk isn’t pre-packaged by nearly anybody - no common Linux or Mac packages, even. So wherever you want to use it, you’ll need to build it. The dependencies are simple, but you have to.

2) like most load-testers, wrk doesn’t make it terribly easy to get the raw data out of it. In wrk’s case, that means writing a lua dumper script that runs in quadratic time. Not the end of the world, but… why do people assume you don’t want raw data from your load test tool? Wrk isn’t alone in this - it’s shockingly difficult to get the same data at full precision out of ApacheBench, for instance.

3) I’m really not sure how to pronounce it. Just as “work?” But how do I make it clear? I sometimes write wg/wrk, which isn’t better.

And now the pluses:

1) low-overhead. Wrk and Locust consistently showed very low overhead when running. In wrk’s case it’s due to its… charmingly quirky concurrency model, which I’ll discuss below. Nonetheless, wrk is both fast and consistent once you have it doing the right thing.

2) reasonably configurable. The lua scripting isn’t my 100% favorite in every way, but it’s a nice solid choice and it works. You can get wrk to do most things you want without too much trouble.

3) simple source code. Okay, I’m an old C guy so maybe I’m biased. But work has short, punchy code that does the simple thing in a mostly obvious way. The two exceptions are two packaged-in dependencies - an http header parser which is fast but verbose, and an event-model library torn out of a Tcl implementation. But if you’re curious how wrk opens a socket, reads data or similar, you can skip the ApacheBench-style reading of a giant library of nonstandard network operations in favor of short, simple and Unixy calls to the normal stuff. As C programs go, wrk is an absolute joy to read.

And Then, the Weird Bits

A load-tester normally has some simple settings. It can let you specify how many requests to run for. Or how many seconds (like wrk does.) Or both, which is nice. It can take a URL, and often options like keepalive (wrk’s keepalive specifically could use some work.)

And, of course, concurrency. ApacheBench’s simple “concurrency” option is just how many connections to use. Another tool might call this “threads” or “workers.”

Wrk, on the other hand has connections and threads and doesn’t really explain what it does with them. After significant inspection of the source, I now know - and I’ll explain it to you.

Remember that event library thing that wrk builds in as a dependency? If you read the code, it’s a little reactor that keeps track of a bunch of connections, including things like timeouts and reconnections.

A Slide from my RubyKaigi talk - wrk was used to collect the data.

A Slide from my RubyKaigi talk - wrk was used to collect the data.

Each thread you give wrk gets its own reactor. The connections are divided up between them, and if the number of threads doesn’t exactly divide the number of connections (example: 3 threads, 14 connections) then the spare connections are just left unused.

All of those connections can be “in flight” at once - you can potentially have every connection open to your specified URL, even with only a single thread. That’s because a reactor can handle as many connections as it has processor power available, not only one at once.

So wrk’s connections are roughly equivalent to ApacheBench’s concurrency, but its threads are a measure of how many OS threads you want processing the result. For a “normal” evented library, something like Node.js or EventMachine, the answer tends to be “just one, thanks.”

This caused the JRuby team and me (independently) a noticeable bit of headache, so I thought I’d mention it to you.

So, Just Use Wrk?

I lean toward saying “yes.” That’s the recommendation from Phusion, the folks who make Passenger. And I suspect it’s not a coincidence that the JRuby team and I independently chose wrk at the same time - most load testing tools aren’t good, and ephemeral port exhaustion is a frequent problem. Wrk is pretty good, and most just aren’t.

On the other hand, the JRuby team and I also found serious performance problems with Puma and Keepalive as a result of using a tool that barely supports turning it off at all. We also had some significant misunderstandings of what “threads” versus “connections” meant, though you won’t have that problem. And for Rails Ruby Bench I did what most people do and built my own, and it’s basically never given me any trouble.

So instead I’ll say: if you’re going to use an off-the-shelf load tester at all, Wrk is a solid choice, though JMeter and Locust are worth considering if they match your use case. A good off-the-shelf tester can have much lower overhead than a tester you built in Ruby, and be more powerful and flexible than a home-rolled one in C.

But if you just build your own, you’re still in very good company.

Learn by Benchmarking Ruby App Servers Badly

(Hey! I usually post about learning important, quotable things about Ruby configuration and performance. THIS POST IS DIFFERENT, in that it is LESSONS LEARNED FROM DOING THIS BADLY. Please take these graphs with a large grain of salt, even though there are some VERY USEFUL THINGS HERE IF YOU’RE LEARNING TO BENCHMARK. But the title isn’t actually a joke - these aren’t great results.)

What’s a Ruby App Server? You might use Unicorn or Thin, Passenger or Puma. You might even use WEBrick, Ruby’s built-in application server. The application server parses HTTP requests into Rack, Ruby’s favored web interface. It also runs multiple processes or threads for your app, if you use them.

Usually I write about Rails Ruby Bench. Unfortunately, a big Rails app with slow requests doesn’t show much difference between the app servers - that’s just not where the time gets spent. Every app server is tolerably fast, and if you’re running a big chunky request behind it, you don’t need more than “tolerably fast.” Why would you?

But if you’re running small, fast requests, then the differences in app servers can really shine. I’m writing a new benchmark so this is a great time to look at that. Spoiler: I’m going to discover that the load-tester I’m using, ApacheBench, is so badly behaved that most of my results are very low-precision and don’t tell us much. You can expect a better post later when it all works. In the mean time, I’ll get some rough results and show something interesting about Passenger’s free version.

For now, I’m still using “Hello, World”-style requests, like last time.

Waits and Measures

I’m using ApacheBench to take these measurements - it’s a common load-tester used for simple benchmarking. It’s also, as I observed last time, not terribly exact.

For all the measurements below I’m running 10,000 requests against a running server using ApacheBench. This set is all with concurrency 1 — that is, ApacheBench runs each request, then makes another one only after the first one has returned completely. We’ll talk more about that in a later section.

I’m checking not only each app server against the others, but also all of them by Ruby version — checking Ruby version speed is kinda my thing, you know?

So: first, let’s look at the big graph. I love big graphs - that’s also kinda my thing.

You can click to enlarge the image, but it’s still pretty visually busy.

What are we seeing here?

Quick Interpretations

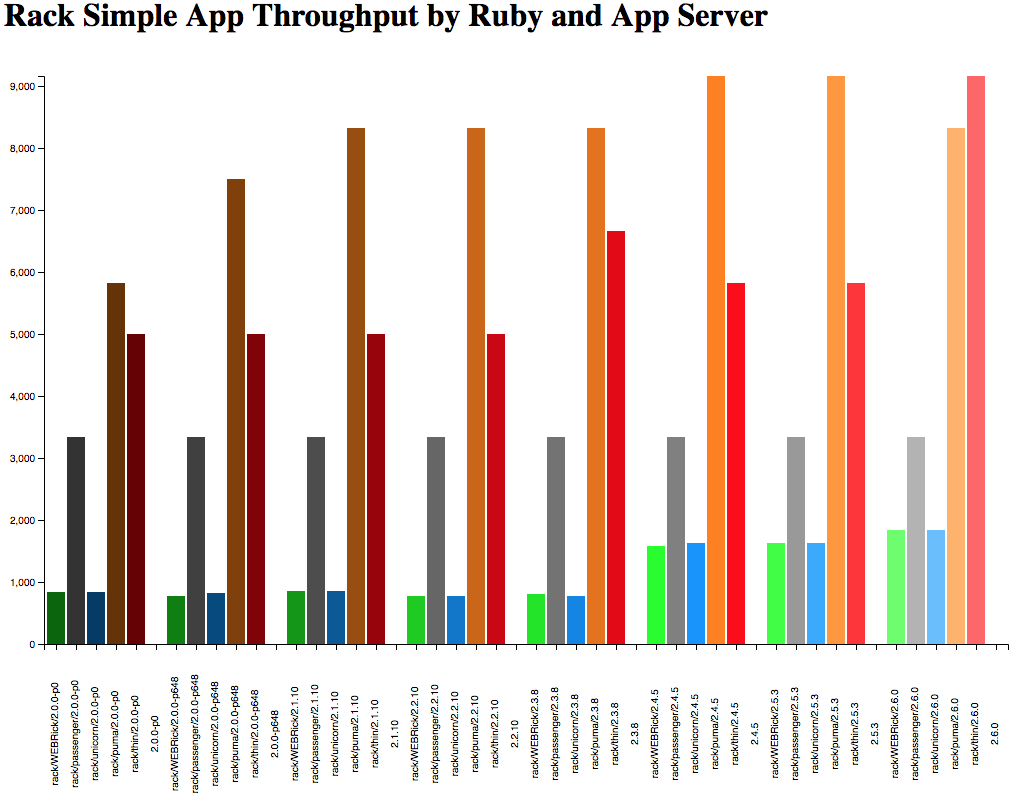
Each little cluster of five bars is a specific Ruby version running a “hello, world” tiny Rails app. The speed is averaged from six runs of 10k HTTP requests. The five different-colored bars are for (in order) WEBrick (green), Passenger (gray), Unicorn (blue), Puma (orange) and Thin (red). Is it just me, or is Thin way faster than you’d expect, given how little we hear about it?

The first thing I see is an overall up-and-to-the-right trend. Yay! That means that later Ruby versions are faster. If that weren’t true, I would be sad.

The next thing I see is relatively small differences across this range. That makes some sense - a tiny Rails app returning a static string probably won’t get much speed advantage out of most optimizations. Eyeballing the graph, I’m seeing something around 25%-40% speedup. Given how inaccurate ApacheBench’s result format is, that’s as nearly exact as I’d care to speculate from this data (I’ll be trying out some load-testers other than ApacheBench in future posts.)

(Is +25% really “relatively small” as a speedup for a mature language? Compared to the OptCarrot or Rails Ruby Bench results it is! Ruby 2.6 is a lot faster than 2.0 by most measures. And remember, we want three times as fast, or +200%, for Ruby 3x3.)

I’m also seeing a significant difference between the fastest and slowest app servers. From this graph, I’d say in order the fastest are Puma, Thin and Passenger, in that order, at the front of the pack. The two slower servers are Unicorn and WEBrick - though both put in a pretty respectable showing at around 70% of the fastest speeds. For fairly short requests like this, the app server makes a big difference - but not “ridiculously massive,” just “big."

But Is Rack Even Faster?

In Ruby, a Rack “Hello, World” app is the fastest most web apps get. You can do better in a systems language like Java, but Ruby isn’t built for as much speed. So: what does the graph look like for the fastest apps in Ruby? How fast is each app server?

Here’s what that graph looks like.

RackSimpleAppThroughput.png

What I see there: this is fast enough that ApacheBench’s output format is sabotaging all accuracy. I won’t speculate exactly how much faster these are — that would be a bad idea. But we’re seeing the same patterns as above, emphasized even more — Puma is several times faster than WEBrick here, for instance. I’ll need to use a different load-tester with better accuracy to find out just how much faster (watch this space for updates!)

Single File Isn’t the Only Way

Okay. So, this is pretty okay. Pretty graphs are nice. But raw single-request speed isn’t the only reason to run a particular web server. What about that “concurrency” thing that’s supposed to be one of the three pillars of Ruby 3x3?

Let’s test that.

Let’s start with just turning up the concurrency on ApacheBench. That’s pretty easy - you can just pass “-c 3” to keep three requests going at once, for instance. We’ve seen the equivalent of “-c 1” above. What does “-c 2” look like for Rails?

Here:

Screen Shot 2019-01-22 at 10.05.12 AM.png

That’s interesting. The gray bars are Passenger, which seems to benefit the most from more concurrency. And of course, the precision still isn’t good, because it’s still ApacheBench.

What if we turn up the concurrency a bit more? Say, to six?

Screen Shot 2019-01-22 at 10.06.32 AM.png


The precision-loss is really visible on the low end. Also, Passenger is still doing incredibly well, so much so that you can see it even at this precision.

Comments and Caveats

There are a lot of good reasons for asterisks here. First off, let’s talk about why Passenger benefits from concurrency so much: a combination of running multiprocess by default and built-in caching. That’s not cheating - you’ll get the same benefit if you just run it out of the box with no config like I did here. But it’s also not comparing apples to apples with other un-configured servers. If I built out a little NGinX config and did caching for the other app servers, or if I manually turned off caching for Passenger, you’d see more similar results. I’ll do that work eventually after I switch off of ApacheBench.

Also, something has to be wrong in my Puma config here. While Puma and Thin get some advantage from higher concurrency, it’s not a large advantage. And I’ve measured a much bigger benefit for that before using Puma, in my RRB testing. I could speculate on why Puma didn’t do better, but instead I’m going to get a better load-tester and then debug properly. Expect more blog posts when it happens.

I hadn’t found Passenger’s guide to benchmarking before now - but kudos to them, they actually specifically try to shoo people away from ApacheBench for the same reasons I experienced. Well done, Phusion. I’ll check out their recommended load tester along with the other promising-looking ones (Ruby-JMeter, Locust, hand-rolled.)

Conclusions

Here’s something I’ve seen before, but had trouble putting words to: if you’re going to barely configure something, set it up and hope it works, you should probably use Passenger. That used to mean a bit more setup because of the extra Passenger/Apache setup or Passenger/NGinX setup. But at this point, Passenger standalone is fairly painless (normal gem-based setup plus a few Linux packages.) And as the benchmarks above show, a brainless “do almost nothing” setup favors Passenger very heavily, because the other app servers tend to need more configuration.

I’m surprised that Puma did so poorly, and I’ll look into why. I’ve always thought Passenger was a great recommendation for SREs that aren’t Ruby specialists, and this is one more piece of evidence in that direction. But Puma should still be showing up better than it did here, which suggests some kind of misconfiguration on my part - Puma uses multiple threads by default, and should scale decently.

That’s not saying that Passenger’s not a good production app server. It absolutely is. But I’ll be upgrading my load-tester and gathering more evidence before I put numbers to that assertion :-)

But the primary conclusion in all of this is simple: ApacheBench isn’t a great benchmarking program, and you should use something else instead. In two weeks, I’ll be back with a new benchmarking run using a better benchmarking tool.

Rails Ruby Bench Speed Roundup, 2.0 Through 2.6

Back in 2017, I gave a RubyKaigi talk tracing Ruby’s performance on Rails Ruby Bench up to that point. I’m still pretty proud of that talk!

But I haven’t kept the information up to date, and there was never a simple go-to blog post with the same information. So let’s give the (for now) current roundup - how well do all the various Rubies do at big concurrent Rails performance? How far has performance come in the last few years?

Plus, this now exists where I can link to it 😀

How I Measure

My primary M.O. has been pretty similar for a couple of years. I run Rails Ruby Bench, a big concurrent Rails benchmark based on Discourse, commonly-deployed open-source forum software that uses Rails. I run 10 processes and 60 threads on an Amazon EC2 m4.2xlarge dedicated instance, then seen how fast I can run a lot of pseudorandom generated HTTP requests through it. This is basically the same as most results you’ve seen on this blog. It’s also what you’ll see in the RubyKaigi talk above if you watch it.

For this post, I’m going to give everything in throughputs - that is, how many requests/second the test gives overall. I’m giving them in two graphs - measured against Discourse 1.5 for older Ruby, and measured against Discourse 1.8 for newer Ruby. One of the problems with macrobenchmarks is that there are basically always compatibility issues - old Discourse won’t work with newer Ruby, 1.8 works with most Rubies but is starting to show its age, and beyond 2.6 it’s really time for me to start measuring against even newer Discourse — which is why you’re getting this post, since it will be hard to compare Rubies side-by-side and it’s useful to have an “up to now” record. Plus I have awhile until Ruby 2.7, so this gives me extra time to get it all working 😊

The new data here - everything based on Discourse 1.8 - is based on 30 batches/Ruby of 30,000 HTTP requests per batch. For the Ruby versions I ran, the whole thing takes in the neighborhood of 12 hours. The older Discourse 1.5 data is much coarser, with 20 batches of 3,000 HTTP requests per Ruby version. My standards have come up a fair bit in the last two years?

Older Discourse, Older Ruby

First off, what did we see when measuring with the older Discourse version? This was in the RubyKaigi talk, so let’s look at that data. Here’s a graph showing the measured throughputs.

That’s a decent increase between 2.0.0 and 2.3.4.

That’s a decent increase between 2.0.0 and 2.3.4.

And here’s a table with the data.

Ruby VersionThroughput (reqs/sec)Speed vs 2.0.0
2.0.0127.6100%
2.1.10168.3132%
2.2.7187.7147%
2.3.4190.3149%

So that’s about a 49% speed increase from Ruby 2.0.0 to 2.3.4 — keeping in mind that you can’t perfectly capture “Ruby version X is Y% faster than version Z.” It’s always a somewhat complicated approximation, for a specific use case.

Newer Numbers

Those numbers were measured with Discourse 1.5, which worked from about Ruby 2.0 to 2.3. But for newer Rubies, I switched to at-the-time-new Discourse 1.8… which had slower HTTP processing, at least for my test. That’s fine. It’s a benchmark, not optimizing a use case for a real business. But it’s important to check how much slower or we can’t compare newer Rubies to older ones. Luckily, Ruby 2.3.4 will run both Discourse 1.5 and 1.8, so we can compare the two.

One thing I have learned repeatedly: running the same test on two different pieces of hardware, even very similar ones (e.g. two different m4.2xlarge dedicated EC2 instances) will give noticeably different results. I’m often checking 10%, 5% or 1% speed differences. I can’t save old results and check against new results on a new instance. Different EC2 instances frequently vary by 1% or more between them, even freshly spun-up. So instead I grab a new instance and re-run the results with the new variables thrown in.

For example, this time I re-ran all the Discourse 1.8 results, everything from Ruby 2.3.4 up to 2.6.0, on a new instance. I also checked a few intermediate Ruby versions, not just the highest current micro version for each minor version - it’s not guaranteed that speed won’t change across a minor version (e.g. Ruby 2.3.X or Ruby 2.5.X) even though that’s usually basically true.

That also let me unify a lot of little individual blog posts that are hard to understand as a group (for me too, not just for you!) It’s always better to run everything all at once, to make sure everything is compared side-by-side. Multiple results over months or years have too many small things that can change - OS and software versions, Ruby commits and patches, network conditions and hardware available…

So: this was one huge run of all the recent Ruby versions on the same disk image, OS, hardware and so on. Each Ruby version is different from the others, of course.

Newer Graphs

Let’s look at that newer data and see what there is to see about it:

Yeah, it’s in a different color scheme. Sorry.

Yeah, it’s in a different color scheme. Sorry.

Up and to the right, that’s nice. Here’s the same data in table form:

Ruby VersionThroughput (reqs/sec)Variance in ThroughputSpeed vs 2.3.4
2.3.4158.30.6100.0%
2.4.0164.31.1103.8%
2.4.1164.11.5103.7%
2.5.0175.10.8110.6%
2.5.3174.41.4110.2%
2.6.0182.30.8115.2%

You can see that the baseline throughput for 2.3.4 is lower - it’s dropped from 190.3 reqs/sec to 158.3 — in the neighborhood of a 20% drop in speed, solely due to Discourse version. I’m assuming the same ratio is true for comparing Discourse 1.8 and 1.5 since we can’t directly compare new Rubies on 1.5 or old Rubies on 1.8 without patching the code pretty extensively.

You can also see tiny drops in speed from 2.4.0 to 2.4.1 and 2.5.0 to 2.5.3 - they’re well within the margin of error, given the variance you see there. It’s nice to see that they’re so close, given how often I assume that every micro version within a minor version is about the same speed!

I’m seeing a surprising speedup between Ruby 2.5 and 2.6 - I didn’t find a significant speedup when I measured before, and here it’s around 5%. But I’ve run this benchmark more than once and seen the result. I’m not sure what changed - I’m using the same Git tag for 2.6 that I have been[1]. So: not sure what’s different, but 2.6 is showing up as distinguishably faster in these tests - you can check the variances above to roughly estimate statistical significance (and/or email me or check the repo for raw data.)

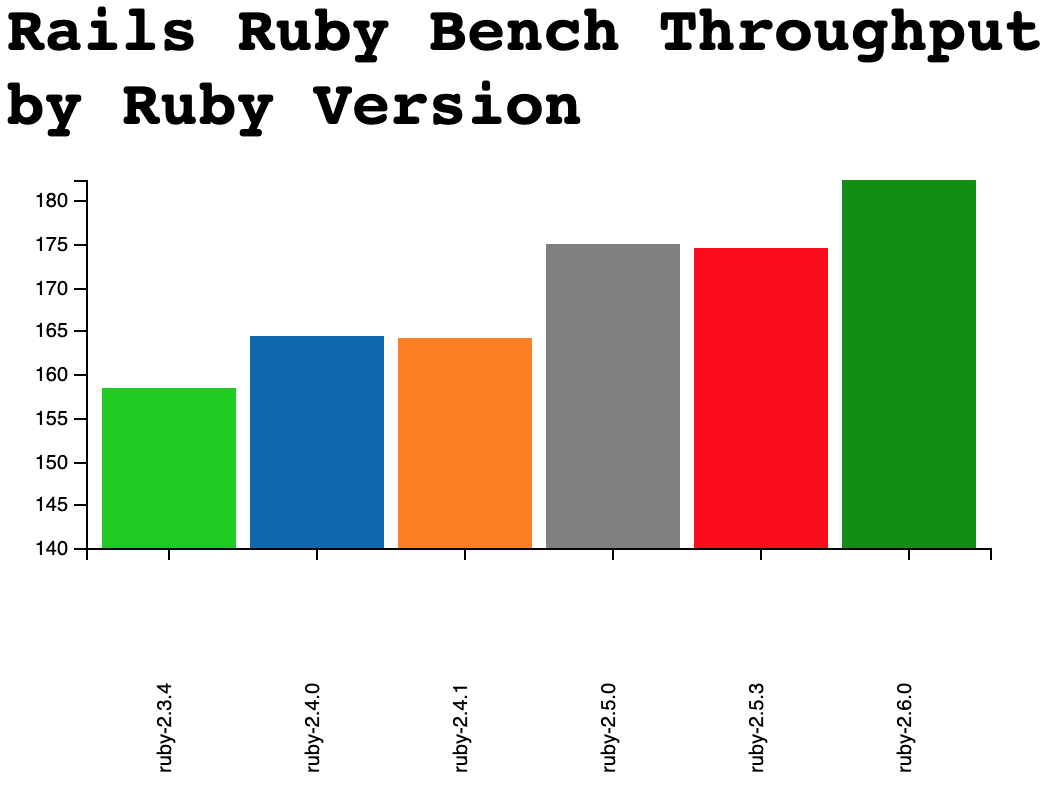
If you’d like an easier-to-read graph, I have a version where I chopped the Y axis higher up, not at zero - it would be misleading for me to show that one first, but it’s better for eyeballing the differences:

Note that the Y axis starts at 140 - this is to check details, NOT get a reasonable overview.

Note that the Y axis starts at 140 - this is to check details, NOT get a reasonable overview.

Conclusions

If we assume we get a 49% speedup from Ruby 2.0.0 to 2.3.4 (see the Discourse 1.5 graph) and then multiply the speedups (they don’t directly add and subtract,) here’s what I’d say for “how fast is RRB for each Ruby?” based on most recent results:

Ruby VersionSpeed vs 2.0.0
2.0.0100%
2.1.10132%
2.2.7147%
2.3.4149%
2.4.0155%
2.4.1155%
2.5.0165%
2.5.3164%
2.6.0172%

For 2.6.1 and 2.6.2, I don’t see any patches that would cause it to be different from 2.6.0. That’s what I’ve seen in early testing as well. I think this is about how fast 2.6.X is going to stay. There are some interesting-looking memory patches for 2.7, but it’s too early to measure the specifics yet…

You’re likely also noticing diminishing returns here - 2.1 had a 32% speed gain, while I’m acting amazed at 2.6.0 getting an extra 6% (after multiplying - 6% relative to 2.0 is the same as 5% relative to 2.3.4 - performance math is a bit funny.) I don’t think we’re going to see a raw, non-JITted 10% boost on both of 2.7 and 2.8. And 10% twice would still only get us to around 208% for Ruby 2.8, even with funny performance math.

Overall, JIT is our big hope for achieving a 300% in the speed column in time for Ruby 3.0. And JIT hasn’t paid off this year for RRB, though we have high hopes for next year. There are also some special-case speedups like Guilds, but those will only help in certain cases - and RRB doesn’t look like one of those cases.

[1] There’s a small chance that I was unlucky when I ran this a couple of times with the release 2.6 and it just looked like it was the same speed as the prerelease. Or the way I did this in lots of small chunks (2.5.0 vs later 2.5 versus 2.6 preview vs later 2.6) hid a noticeable speedup because I was measuring too many small pieces? Or that I was significantly unlucky both times I ran this benchmark, more recently. It seems unlikely that the request-speed graphs I saw for 2.6 result in a 5% faster throughput - not least because I checked throughputs before, too, even though I graphed request speeds in those blog posts.

Benchmarking Hongli Lai's New Patch for Ruby Memory Savings

Recently, Hongli Lai of Phusion Passenger fame, has been looking at how to reduce CRuby’s memory usage without going straight to jemalloc. I think that’s an admirable goal - especially since you can often combine different fixes with good results.

When people have an interesting Ruby speedup they’d like to try out, I often offer to benchmark it for them - I’m trying to improve our collective answer to the question, “does this make Rails faster?”

So: let’s examine Hongli’s fix, benchmark it, and see what we think of it!

The Fix

Hongli has suggested a specific fix - he mentioned it to me, and I tested it out. The basic idea is to occasionally use malloc_trim to free additional blocks of memory that would otherwise not be returned to the OS.

Specifically: in gc_start(), near the end, just after the gc_marks() call, he suggests that you can call:

if(do_full_mark) { malloc_trim(0) }

This will take extra CPU cycles to trim away memory we know we’ll have to get rid of - but only when doing a “full mark”, part of Ruby’s mark/sweep garbage collection. The idea is to spend extra CPU cycles to reduce memory usage. He also suggested that you can skip the “only on a full-mark pass” part of it, and just call malloc_trim(0) every time. That might divide the work over more iterations for more even performance, but might cost overall performance.

Let’s call those variation 1 (only trim on full-mark), variation 2 (trim on every GC, full-mark or not) and baseline (released Ruby 2.6.0.)

(Want to know more about Ruby’s GC and what the pieces are? I gave a talk at RubyKaigi in 2018 on that.)

Based on the change to Ruby’s behavior, I’ll refer to this as the “trim-on-full-mark” patch. I’m open to other names. It is, in any case, a very small patch in lines of code. Let’s see how the effect looks, though!

The Trial

Starting from released Ruby 2.6.0, I tested “plain vanilla” Ruby 2.6.0 and the two variations using Rails Ruby Bench. For those of you just joining us, that means running a Rails app server (including database and Redis) on a dedicated m4.2xlarge EC2 instance, with everything running entirely on-instance (no network) for stability reasons. For each “batch,” RRB generates (in this case) 30,000 pseudorandom HTTP requests against a copy of Discourse running on a large Puma setup (10 processes, 60 threads) and sees how fast it can process them all. Other than having only small, fast database requests, it’s a pretty decent answer to the question, “how fast can Rails process HTTP requests on a big EC2 instance?”

As you may recall from my jemalloc speed testing, running 10 large Rails servers, even on a big EC2 instance, simply consumes all the memory. You won’t see a bunch of free memory sitting around because one server or another would take it. Instead, using less memory will manifest as faster request times and higher throughputs. That’s because more memory can be used for caching, or for less-frequent garbage collection. It won’t be returned to the OS.

This trial used 15 batches of 30,000 requests for each variant (V1, V2, baseline.) That won’t catch tiny, subtle differences (say 0.25%), but it’s pretty good for rough “does this work?” checks. It’s also very representative of a fairly heavy Rails workload.

I calculated median, standard deviation and so on then realized: look, it’s 15 batches. These are all approximations for eyeballing your data points and saying, “is there a meaningful difference?” So, look below for the graph. Looking at it, there does appear to be a meaningful difference between released Ruby 2.6 (orange) and the two variations. I do not see a meaningful difference between Variation 1 and Variation 2. Maybe one has slightly more predictable response time than the other? Maybe no? If there’s a significant performance difference here between V1 and V2, it would want more samples to be able to see it.

The Y axis is requests/second over the 30k requests. The X axis is Rand(0.0, 1.0). The Y axis does not start at zero, so this is not a huge difference.

The Y axis is requests/second over the 30k requests. The X axis is Rand(0.0, 1.0). The Y axis does not start at zero, so this is not a huge difference.

Hongli points out that this article gives some excellent best practices for benchmarking. RRB isn’t perfect according to its recommendations — for instance, I don’t run the CPU scheduler on a dedicated core or manually set process affinity with cores. But I think it rates pretty decently, and I think this benchmark is giving uniform enough results here, in simple enough circumstances, to trust the result.

Based on both eyeballing the graph above and using a calculator on my values, I’d call that about 1% speed difference. It appears to be about three standard deviations of difference between baseline (released 2.6) and either variation. So it appears to be a small but statistically significant result.

That’s good, if it holds for other workloads - 1 line of changed code for a 1% speedup is hard to complain about.

The Fix, More Detail

So… What does this really do? Is it really simple and free?

Normally, Ruby can only return memory to the OS if the blocks are at the end of its address space. It checks it occasionally, and returns blocks it if it can. That’s a very CPU-cheap way to handle it, which makes it a good default in many cases. But it winds up retaining more memory because freed blocks in the middle can only be reused by your Ruby process, not returned for a different process to use. So mostly, long-running Ruby processes expand up to a size with some built-in waste (“fragmentation”) and then stay that big.

With Hongli’s change, Ruby scans all of memory on certain garbage collections (Variant 1) or all garbage collections (Variant 2) and frees blocks of memory that aren’t at the end of its memory space.

The function being called, malloc_trim, is part of GLibC’s memory allocator. So this won’t directly stack with jemalloc, which doesn’t export the exact same interface, and handles freeing differently. My previous results with jemalloc suggest that this isn’t enough, by itself, to bring GLibC up to jemalloc’s level. Jemalloc already frees more memory to the OS than GLibC, and can be tuned with the lg_dirty_mult option to release even more aggressively. I haven’t timed different tunings of jemalloc, though.

A Possible Limitation

This seems like a good patch to me, but just to mention a problem it could have: the malloc_trim API is GLibC-specific. This would need to be #ifdef’d out when Ruby is compiled with jemalloc. The core team may not be thrilled to add extra allocator-specific behavior, even if it’s beneficial.

I don’t see this as a big deal, but I’m not the one who gets to decide.

Conclusions

I think Hongli’s patch shows a lot of promise. I’m curious how it compares on smaller benchmarks. But especially for Variation 1 (only on full-mark GC), I don’t think it’ll be very different — most small benchmarks do very few full-mark garbage collections. Most do very few garbage collections, period.

So I think this is a free 1% speed boost for large, memory-constrained Rails applications, and that it doesn’t hurt anybody else. I’ll look forward to the results on smaller benchmarks and more CPU-bound Ruby code.

Ruby Register Transfer Language - But How Fast Is It on Rails?

I keep saying that one of the first Ruby performance questions people ask is, “will it speed up Rails?” I wrote a big benchmark to answer that question - short version: I run a highly-concurrent Discourse server to max out a large, dedicated EC2 instance and see how fast I can run many HTTP requests through it, with requests meant to simulate very simple user access patterns.

Recently, the excellent Vladimir Makarov wrote about trying to alter CRuby to use register transfer instead of a stack machine for passing values around in its VM. The article is very good (and very technical.) But he points out that using registers isn’t guaranteed to be a speedup by itself (though it can be) and it mostly enables other optimizations. Large Rails apps are often hard to optimize. So then, what kind of speed do we see with RTL for Rails Ruby Bench, the large concurrent Discourse benchmark?

JIT

First, an aside: Vlad is the original author of MJIT, the JIT implementation in Ruby 2.6. In fact, his RTL work was originally done at the same time as MJIT, and Takashi Kokubun separated the two so that MJIT could be separately integrated into CRuby.

In a moment, I’m going to say that I did not speed-test the RTL branch with JIT. That’s a fairly major oversight, but I couldn’t get it to run stably enough. JIT tends to live or die on longer-term performance, not short-lived processes, and the RTL branch, with JIT enabled, crashes frequently on Rails Ruby Bench. It simply isn’t stable enough to test yet.

Quick Results

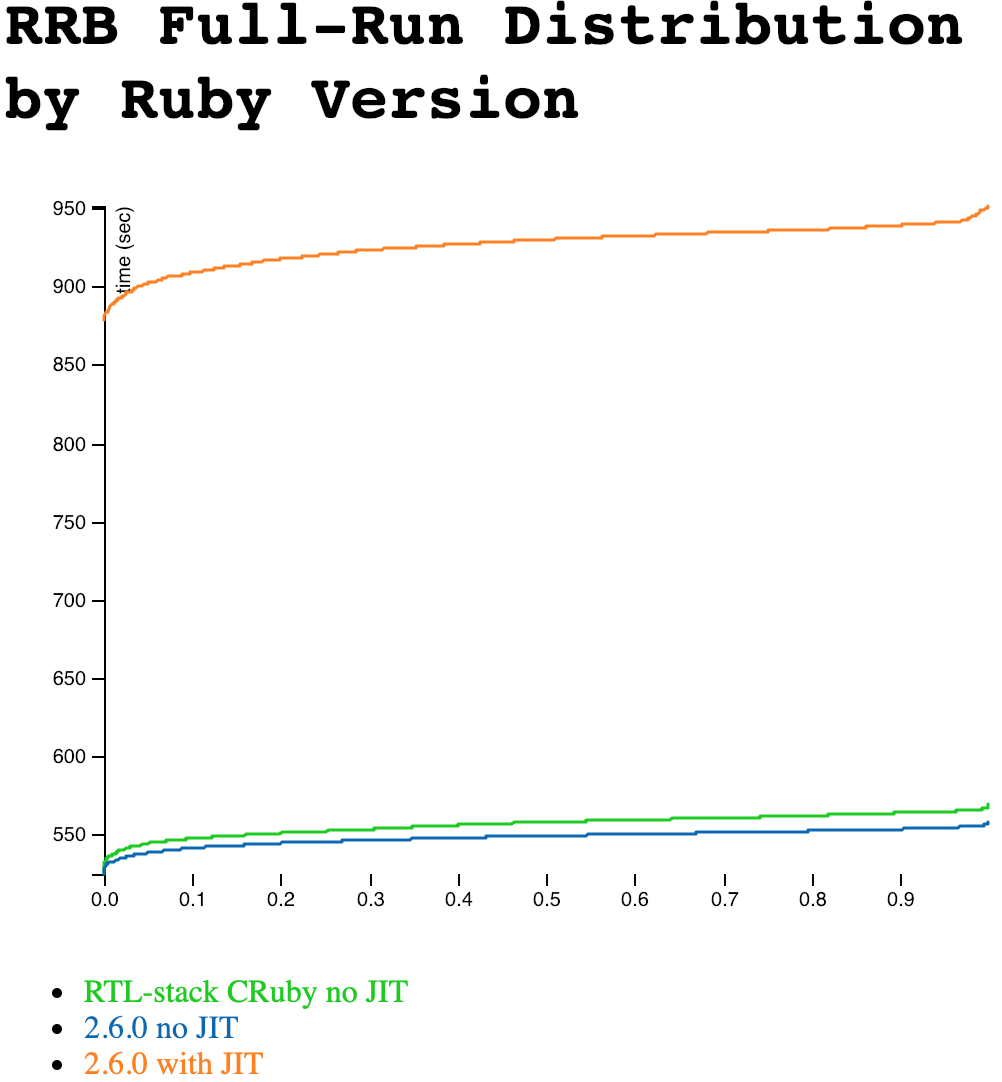
Since Vlad’s branch of Ruby is based (approximately) on CRuby 2.6.0, it seems fair to test it against 2.6.0. I used a recent commit of Vlad’s branch. You may recall that 2.6.0 JIT doesn’t speed up Rails, or Rails Ruby Bench, yet either. So the 2.6-with-JIT numbers below are significantly slower than JITless 2.6. That’s the same as when I last timed it.

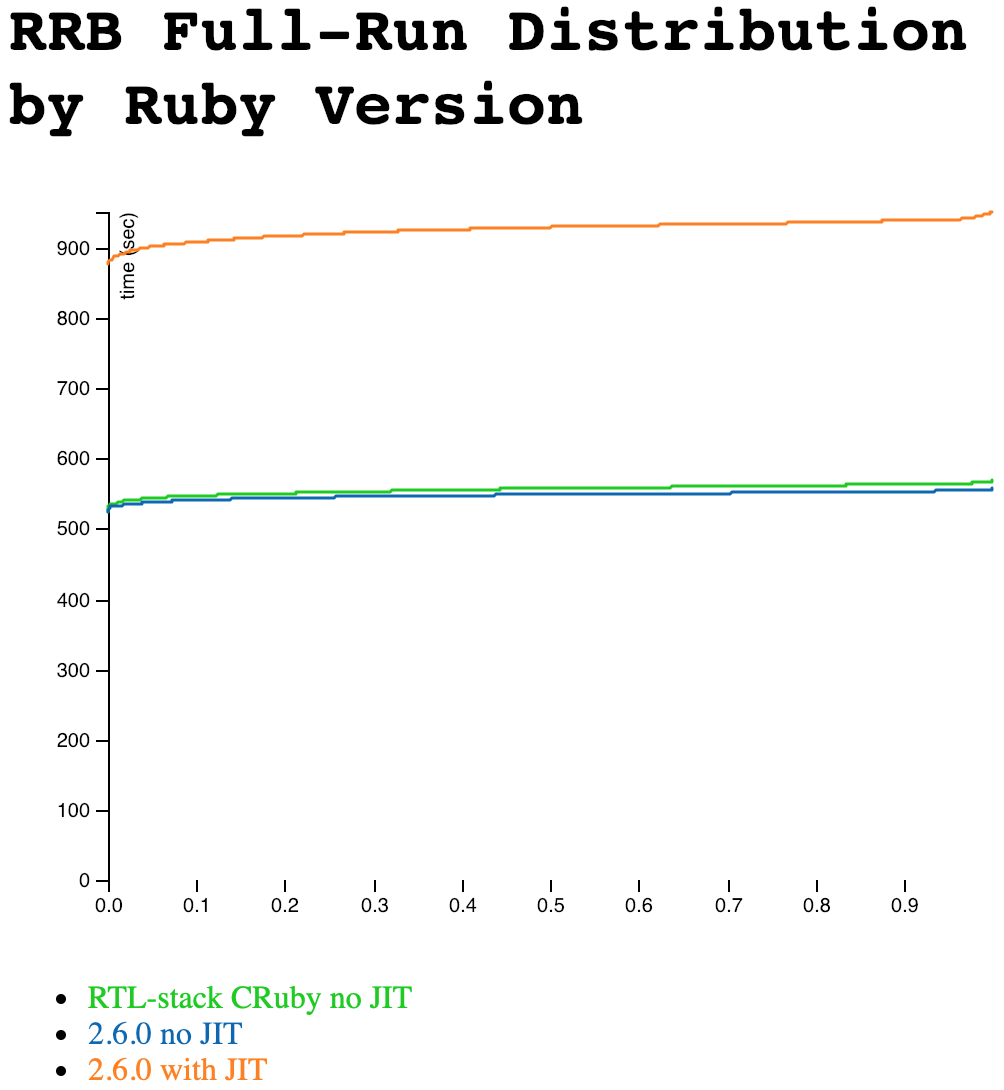
Each graph line below is based on 30 runs, with each using 100,000 HTTP requests plus 100 warmup requests. The very flat, low-variance lines you see below are for that reason - and also that newer Ruby has very even, regular response times, and I use a dedicated EC2 instance running a test that avoids counting network latency.

Hard to tell those top two apart, isn’t it?

Hard to tell those top two apart, isn’t it?

You’ll notice that it’s very hard to tell the RTL and stack-based (normal) versions apart, though JIT is slower. We can zoom in a little and chop the Y axis, but it’s still awfully close. But if you look carefully… it looks like the RTL version is very slightly slower. I haven’t shown it on this graph, but the variance is right on the border of statistical significance. So RTL may, possibly, be just slightly slower. But there’s at least a fair chance (say one in three?) that they’re exactly the same and it’s a measurement artifact, even with this very large number of samples.

rtl_vs_26_closer.png

Conclusions

I often feel like Rails Ruby Bench is unfair to newer efforts in Ruby - optimizing “most of” Ruby’s operations is frequently not enough for good RRB results. And its dependencies are extensive. This is a case where a promising young optimization is doing well, but — in my opinion — isn’t ready to roll out on your production servers yet. I suspect Vlad would agree, but it’s nice to put numbers to it. However, it’s also nice to see that his RTL code is mature enough to run non-JITted with enough stability for very long runs of Rails Ruby Bench. That’s a difficult stability test, and it held up very well. There were no crashes without supplying the JIT parameter on the command line.

Microbenchmarks vs Macrobenchmarks (i.e. What's a Microbenchmark?)

Sometimes you need to measure a few Rubies…

Sometimes you need to measure a few Rubies…

I’ve mentioned a few times recently that something is a “microbenchmark.” What does that mean? Is it good or bad?

Let’s talk about that. Along the way, we’ll talk about benchmarks that are not microbenchmarks and how to pick a scale/size for a specific benchmark.

I talk about this because I write benchmarks for Ruby. But you may prefer to read it because you use benchmarks for Ruby - if you read the results or run them. Knowing what can go wrong in benchmarks is like learning to spot bad statistics: it’s not easy, but some practice and a few useful principles can help you out a lot.

Microbenchmarks: Definition and Benefits

The easiest size of benchmark to talk about is a very small benchmark, or microbenchmark.

The Ruby language has a bunch of microbenchmarks that ship right in the language - a benchmarks directory that’s a lot like a test directory, but for speed. The code being timed is generally tiny, simple and specific.

Each one is a perfect example of a microbenchmark: it tests very little code, sometimes just a single Ruby operation. If you want to see how fast a particular tiny Ruby operation is (e.g. passing a block, a .each loop, an Integer plus or a map) a microbenchmark can measure that very exactly while measuring almost nothing else.

A well-tuned microbenchmark can often detect very tiny changes, especially when running many iterations per step (see “Writing Good Microbenchmarks” below.) If you see a result like “this optimization speeds up Ruby loops by half of one percent", you’re pretty certainly looking at the result of a microbenchmark.

Another advantage of running just one small piece of code is that it’s usually easy and fast. You don’t do much setup, and it doesn’t usually take long to run.

Microbenchmarks: Problems

A good microbenchmark measures one small, specific thing. This strength is also a weakness. If you want to know how fast Ruby is overall, a microbenchmark won’t tell you much. If you get lots of them together (example: Ruby’s benchmarks directory) then it still won’t tell you much. That’s because they’re each written to test one feature, but not set up according to which features are used the most, or in what combination. It’s like reading the dictionary - you may have all the words, but a normal block of text is going to have some words a lot (“a,” “the,” “monkey”) and some words almost never (“proprioceptive,” “batrachian,” “fustian.”)

In the same way, running your microbenchmarks directory is going to overrepresent uncommon operations (e.g. passing a block by typecasting something to a proc and passing via ampersand; dynamically adding a module as a refinement) and is going to underrepresent common operations (method calls, loops.) That’s because if you run about the same number of each, that’s not going to look much like real Ruby code — real Ruby code uses common operations a lot, and uncommon operations very little.

A microbenchmark isn’t normally a good way to test subtle, pervasive changes since it’s measuring only a short time at once. For instance, you don’t normally test garbage collector or caching changes with a microbenchmark. To do so you’d have to collect a lot of different runs and check their behavior overall… which quickly turns into a much larger, longer-term benchmark, more like the larger benchmarks I describe later in this article. It would have completely different tradeoffs and would need to be written differently.

Sometimes a tiny, specific magnifier is the right tool

Sometimes a tiny, specific magnifier is the right tool

Microbenchmarks are excellent to check a specific optimization, since they only run that optimization. They’re terrible to get an overall feel for a speedup, because they don’t run “typical” code. They also usually just run the one operation, often over and over. This is also not what normal Ruby code tends to do, and it affects the results.

Lastly, a microbenchmark can often look deceptively simple. A tiny confounding factor can spoil your entire benchmark without you noticing. Say you were testing the speed of a “rescue nil” clause and your newer Ruby version didn’t just rescue faster — it also incorrectly failed to throw the exception you wanted. It would be easy for you to say “look how fast this benchmark is!” and never realize your mistake.

Writing Good Microbenchmarks

If you’re writing or evaluating a microbenchmark, keep this in mind: your test harness needs to be very simple and very fast. If your test takes 15 milliseconds for one whole run-through, 3 milliseconds of overhead is suddenly a lot. Variable overhead, say between 1 and 3 milliseconds, is even worse - you can’t usually subtract it out and you don’t want to separately measure it.

What you want in a test harness looks like benchmark_ips or benchmark_driver. You want it to be simple and low-overhead. Often it’s a good idea to run the operation many times - perhaps 100 or 1000 times per run. That means you’ll get a very accurate average with very low overhead — but you won’t see how much variation happens between runs. So it’s a good method if you’re testing something that basically always takes about equally long.

Since microbenchmarks are very speed-dependent, try to avoid VMs or tools like Docker which can add variation to your results. If you can run your microbenchmark outside a framework (e.g. Rails) then you usually should. In general, simplify by removing everything you can.

You may also want to run warmup iterations - these are extra, optional benchmark runs before you start timing the result. If you want to know the steady-state performance of a benchmark, give it lots of warmup iterations so you’ll find out how fast it is after it’s been running awhile. Or if it’s an operation that is usually done only a few times, or occasionally, don’t give it warmup at all and see how it does from a cold start.

Warmup iterations can also avoid one-time performance costs, such as class loading in Java or reading a rarely-used file from disk. The very first time you do that it will be slow, but then it will be fast every other time - even a single warmup iteration can often make those costs nearly zero. That’s either very good if you don’t want to measure them, or very bad if you do.

Since microbenchmarks are usually meant to measure a specific operation, you’ll often want to turn off operations that may confound it - for instance, you may want to garbage collect just before the test, or even turn off GC completely if your language supports it.

Keep in mind that even (or especially!) a good microbenchmark will give chaotic results as situations change. For instance, a microbenchmark won’t normally get slightly faster every Ruby version. Instead, it will leap forward by a huge amount when a new Ruby version optimizes its specific operation… And then do nothing, or even get slower, in between. The long-term story may say “Ruby keeps getting faster!”, but if you tell that story entirely by how fast passing a symbol as a block is, you’ll find that it’s an uneven story of fits and starts — even though, in the long term, Ruby does just keep getting faster.

You can find some good advice on best practices and potential problems of microbenchmarking out on the web.

Macrobenchmarks

Okay, if those are microbenchmarks, what’s the opposite? I haven’t found a good name for these, so let’s call them macrobenchmarks.

Rails Ruby Bench is a good example of a macrobenchmark. It uses a large, real application (called Discourse) and configures it with a lot of threads and processes, like a real company would host it. RRB loads it with test data and generates real-looking URLs from multiple users to simulate real-world application performance.

In many ways, this is the mirror image opposite of a microbenchmark. For instance:

  • It’s very hard to see how one specific optimization affects the whole benchmark

  • A small, specific optimization will usually be too small to detect

  • Configuring the dependencies is usually hard; it’s not easy to run

  • There’s a lot of variation from run to run; it’s hard to get a really exact figure

  • It takes a long time for each run

  • It gives a very good overview of current Ruby performance

  • It’s a great way to see how Ruby “tuning” works

  • It’s usually easy to see a big mistake, since a sudden 30%+ shift in performance is nearly always a testing error

  • “Telling a story” is easier, because the overview at every point is more accurate; less chaotic results

In other words, it’s good where microbenchmarks are bad, and bad where they’re good. You’ll find that a language implementor (e.g. the Ruby Core Team) wants more microbenchmarks so they can see the effects of their work. On the other hand, a random Ruby developer probably only cares about the big picture (“how fast is this Ruby version? Does the Global Method Cache make much speed difference?”) Large and small benchmarks are for different audiences.

If a good microbenchmark is judged by its exactness and low variation, a good macrobenchmark is judged by being representative of some workload. “Yes, this is a typical Rails app” would be high praise for a macrobenchmark.

Good Practices for Macrobenchmarks

2019-microbenchmarks-macro.png

A high-quality macrobenchmark is different than a high-quality microbenchmark.

While a microbenchmark cannot, and usually should not, measure large systemic effects like garbage collection, a good macrobenchmark nearly always wants to — and usually needs to. You can’t just turn off garbage collection and run a large, long-term benchmark without running out of memory.

In a good microbenchmark you turn off everything nonessential. In a good macrobenchmark you turn off everything that is not representative. If garbage collection matters to your target audience, you should leave it on. If your audience cares about startup behavior, be careful about too many warmup iterations — they can erase the initial startup iterations’ effects.

This requires knowing (or asking, or assuming, or testing) a lot about what your audience wants - you’ll need to figure out what’s in and what’s out. In a microbenchmark, one assumes that your benchmark will test one tiny thing and developers can watch or ignore it, depending. In a macrobenchmark, you’ll have a lot of different things going on. Your responsibility is to communicate to your audience what you’re checking. Then, be sure to check what you said you would.

For instance, Rails Ruby Bench attempts to be “a mid-sized typical Rails application as deployed by a small but successful startup.” That helps a lot to define the audience and operations. Should RRB test warmup iterations? Only a little - mostly it’s about steady-state performance after warmup is finished. Early performance is mostly important to represent how quickly you can edit/debug the application. Should RRB test garbage collection? Yes, absolutely, that’s an important performance consideration to the target audience. Should it test Redis performance? Only as far as necessary for actions. The target audience doesn’t directly care about Redis except as it concerns overall performance.

A good macrobenchmark is defined by the way you choose, implement and communicate the simulated workload.

Conclusions: Choosing Your Benchmark Scale

Whether you’re writing a benchmark or looking for one, a big question is “how big should the benchmark be?” A very large benchmark will be less exact and harder to run for yourself. A tiny benchmark may not tell you what you care about. How big a benchmark should you look for? How big a benchmark should you write?

The glib answer is “exactly big enough and no bigger.” Not very useful, is it?

Here’s a better answer: who’s your target audience? It’s okay if the answer is “me” or “me and my team” or “me and my company.”

A very specific audience usually wants a very specific benchmark. What’s the best benchmark for “you and your team?” Your team’s app, usually, run in a new Ruby version or with specific settings. If what you really care about is “how fast will our app be?” then figuring out some generalized “how fast is Ruby with these settings?” benchmark is probably all work and no benefit. Just test your app, if you can.

If your answer is, “to convince the Internet!” or “to show those Ruby haters!” or even “to show those mindless Ruby fans!” then you’re probably on the pathway to a microbenchmark. Keep it small and you can easily “prove” that a particular operation is very fast (or very slow.) Similarly, if you’re a vendor selling something, microbenchmarks are a great, low-effort way to show that your doodad is 10,000% faster than normal Ruby. Pick the one thing you do really fast and only measure that. Note that just because you picked a specific audience doesn’t mean they want to hear what you have to say. So, y’know, have fun with that.

That’s not to say that microbenchmarks are bad — not at all! But they’re very specific, so make sure there’s a good specific reason for it. Microbenchmarks are at their best when they’re testing a specific small function or language feature. That’s why language implementors use so many of them.

A bigger benchmark like RRB is more painful. It’ll be harder to set up. It’ll take longer to run. You’ll have to control for a lot of factors. I only run a behemoth like that regularly because AppFolio pays the server bills (thank you, AppFolio!) But the benefit is that you can answer a larger, poorly-defined question like, “about how fast is a big Rails application?” There’s also less competition ;-)

Test Ruby's Speed with Rails and Rack "Hello, World" Apps

As I continue on the path to a new benchmark for Ruby speed, one important technique is to build a little at a time, and add in small pieces. I’m much more likely to catch a problem if I keep adding, checking and writing about small things.

As a result, you get a nice set of blog posts talking about small, specific aspects of speed testing. I always think this kind of thing is fascinating, so perhaps you will too!

Two weeks ago, I wrote about a simple speed-test - have a Rails 4.2 route return a static string, as a kind of Rails “Hello, World” app. Rack’s well-known “Hello, World” app is even simpler. On the way to a more interesting Rails-based Ruby benchmark, let’s speed test those two, and see how the new test infrastructure holds up!

(Scroll down for speed graphs by Ruby version.)

ApacheBench and Load-Test Clients

I always felt a little self-conscious about just using RestClient and Ruby for my load-testing for Rails Ruby Bench. But I like writing Ruby, you know? And as a load test gets more complicated, it’s nice to use a real, normal programming language instead of a test specification language. But then, perhaps there’s virtue in using all this software that other people write.

So I thought I’d give ApacheBench a try.

ApacheBench is wonderfully simple, which is nice. It handles concurrent requests. It’s fast. It gives very stable results.

I initially used its CSV output format, which automatically bins all requests by speed. It only tells you, for a given percentage of your requests, how slow the slowest of them was. You get 100 numbers, no matter how many requests, which each represent a “slowest in this percentage of requests” measurement. It’s… okay. I used it last time.

Of course, it also uses either of two weird output formats. And unfortunately, the really detailed format (GNUplot) rounds everything to the nearest second (for start time) or millisecond (for durations.) For small, fast requests that’s not very exact. So I can either get my data pre-histogrammed (can’t check individual requests) or very low-precision.

I may be switching back from ApacheBench to RestClient-or-something again. We’ll see.

Making Lemonade

I gathered a fair bit of data, in fact, where the processing time was all just “1” - that is, it took around 1 millisecond of processing time to return a value. That’s nice, but it’s not very exact. Graphing that would be 1) very boring and 2) not very informative.

And then I realized I could graph throughputs! While each request was fast enough to be low-precision in the file, I still ran thousands of them in a row. And with that, I had the data I wanted, more or less.

So! Two weeks ago I tried using ApacheBench’s CSV format and got stable, simple, hard-to-fathom results. This week I got somewhat-inaccurate results that I could still measure throughputs from. And I got closer to the kind of results I expected, so that’s nice.

Specifically, here is this week’s results for Rails “Hello, World”:

None of this uses JIT for this benchmark. You should expect JIT to be a bit slower than no JIT on 2.6 for Rails, though.

None of this uses JIT for this benchmark. You should expect JIT to be a bit slower than no JIT on 2.6 for Rails, though.


Again, keep in mind that this is a microbenchmark - checking a small, very specific set of functionality which means you may see somewhat chaotic results from Ruby version to Ruby version. But this is a pretty nice graph, even if it may be partly by chance!

Great! Rack is even more of a microbenchmark because the framework is so simple. What does that look like?

The Y axis here is requests/second. But keep in mind this is 100% single-thread single-CPU. We could have much higher throughput with some concurrency.

The Y axis here is requests/second. But keep in mind this is 100% single-thread single-CPU. We could have much higher throughput with some concurrency.

That’s similar, with even more of a dip between 2.0 and late 2.3. My guess is that the apps are so simple that we’re not seeing any benefit from the substantial improvements to garbage collection between those versions. This is a microbenchmark, and it definitely doesn’t test everything it could. And that’s why you’ll see a long series of these blog posts, testing one or two interesting factors at a time, as the new code slowly develops.

Conclusions

This isn’t a post with many far-reaching conclusions yet. This benchmark is still very simple. But here are a few takeaways:

  • ApacheBench file format isn’t terribly exact, so there will be some imprecision with it

  • 2.6 did gain some speed for Rails, but RRB is too heavyweight to really notice

  • Quite a lot of the speed gain between 2.0 and 2.3 didn’t help really lightweight apps

  • Rails 2.4 holds up pretty well as a way to “historically” speed-test Rails across Rubies

See you in two weeks!

A Short Speed History of Rails "Hello, World"

I’ve enjoyed working on Rails Ruby Bench, and I’m sure I’ll continue doing so for years yet. At the very least, Ruby 3x3 isn’t done and RRB has more to say before it’s finished. But…

RRB is very “real world.” It’s complicated. It’s hard to set up and run. It takes a very long time to produce results — I often run larger tests all day, even for simple things like how fast Ruby 2.6 is versus 2.5. Setting up larger tests across many Ruby versions is a huge amount of work. Now and then it’s nice to sit back and do something different.

I’m working on a simpler benchmark, something to give quicker results and be easier for other people to run. But that’s not something to just write and call done - RRB has taken awhile, and I’m sure this one will too. Like all good software, benchmarks tend to develop step by step.

So: let’s take some first steps and draw some graphs. I like graphs.

If I’m going to ask how fast a particular operation is across various Rubies… Let’s pick a nice simple operation.

Ruby on Rails “Hello, World”

I’ve been specializing in Rails benchmarks lately. I don’t see any reason to stop. So let’s look at the Ruby on Rails equivalent of “Hello, World” - a controller action that just returns a static string. We’ll use a single version of Rails so that we measure the speed of Ruby, not Rails. It turns out that with minor adjustments, Rails 4.2 will run across all Rubies from 2.0.0p0 up through 2.6’s new-as-I-write-this release candidate. So that’s what we’ll use.

There are a number of fine load-testing applications that the rest of the world uses, while I keep writing my little RestClient-based scripts in Ruby. How about we try one of those out? I’m thinking ApacheBench.

I normally run quick development tests on my Mac laptop and more serious production benchmarks on EC2 large dedicated instances running Ubuntu. By and large, this has worked out very well. But we’ll start out by asking, “do multiple runs of the benchmark say the same thing? Do Mac and Ubuntu runs say the same thing?”

In other words, let’s check basic stability for this benchmark. I’m sure there will be lots of problems over time, but the first question is, does it kind of work at all?

A Basic Setup

In a repo called rsb, I’ve put together a trivial Rails test app, a testing script to run ApacheBench and a few other bits and bobs. There are also initial graphing scripts in my same data and graphing repository that I use for all my Rails Ruby Bench graphs.

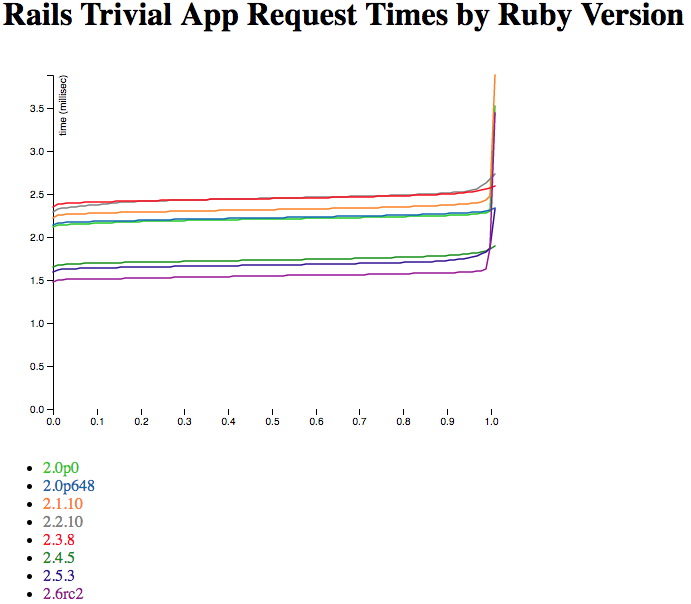
First off, what does a simple run-on-my-Mac version of 10,000 tiny Rails requests look like on different Ruby versions? Here’s what I got before I did any tuning.

Ah yes, the old “fast fast fast oh god no” pattern.

Ah yes, the old “fast fast fast oh god no” pattern.

Hrm. So, that’s not showing quite what I want. Let’s trim off the top 2% of the requests as outliers.

Screen Shot 2018-12-21 at 12.56.15 PM.png

That’s better. What you’re seeing is sorted by how many of the requests were a given speed. The first thing to notice, of course, is that they’re all pretty fast. When basically your entire graph is between 1.5 milliseconds per request and 3 milliseconds per request, you’re not doing too badly.

The ranking overall moves in the right direction — later Rubies are mostly faster than older Rubies. But it’s a little funky. Ruby 2.1.10 is a lot slower than 2.0.0p648 for most of the graph, for instance. And 2.4.5 is nicely speedy, but 2.5.3 is less so. Are these some kind of weird Mac-only results?

Ubuntu Results

I usually do my timing on a big EC2 dedicated instance (m4.2xlarge) running Ubuntu. That’s done pretty well for the last few years, so what does it say about this new benchmark? And if we run it more than once, does it say the same thing?

Let’s check.

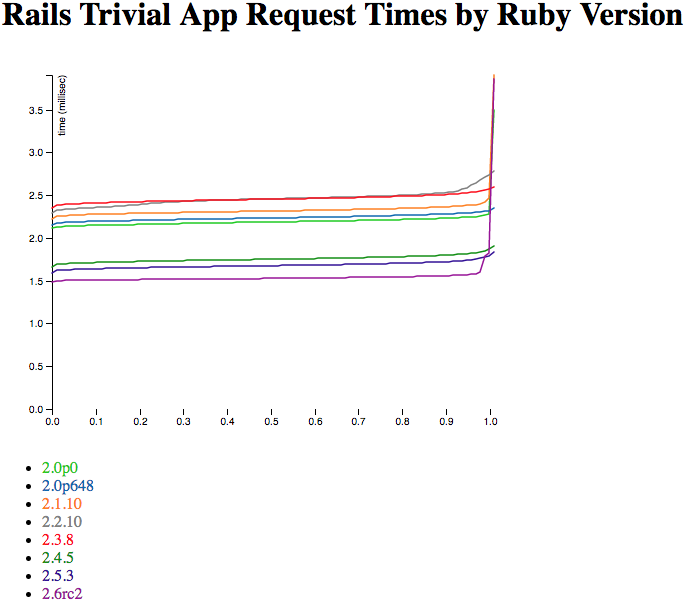
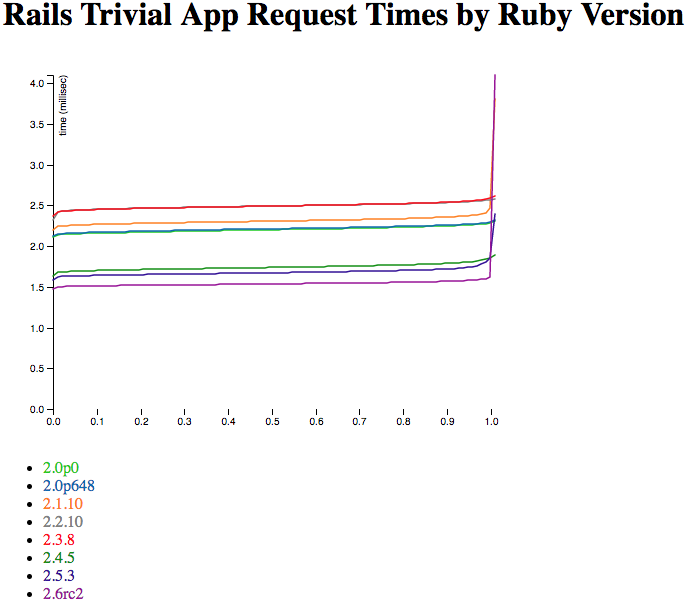
Here are two independently-run sets of Ubuntu results, also with 10,000 requests collected via ApacheBench. How do they compare?

So, huh. This has a much sharper curve on the slow end - that’s because the EC2 instance is a lot faster than my little Mac laptop, core for core. If I graphed without trimming the outliers, you’d also see that its slowest requests are a lot faster - more like 50 or 100 milliseconds rather than 200+. Again, that’s mostly the difference in core-for-core speed.

The order of the Rubies is quite stable - and also includes two new ones, because I’m having an easier time compiling very old (2.0.0p0) and new (2.6.0rc2) Rubies on Ubuntu than my Mac. (2.6.0 final wasn’t released when I collected the data, but rc2 is nearly exactly the same speed.) But the two independent runs have a very similar relative speed and order between the two Rubies. But both are quite different from the Mac run, up above. So Mac and Ubuntu are not equivalent here. (Side note: the colors of the Ruby lines are the same on all the graphs, so 2.5.3 will be the dark-ish purple for every graph on this post, while 2.1.10 will be orange.)

The overall speed isn’t much higher, though. Which suggests that we’re not seeing very much Rails speed in here at all - a faster processor doesn’t make much change in how long it takes to hand a request back and forth between ApacheBench and Rails. We can flatten that curve, but we can’t drop it much from where it starts. Even my little Mac is pretty speedy for tiny requests like this.

Is it that we’re not running enough requests? Sometimes speed can be weird if you’re taking a small sample, and 10,000 HTTP requests is pretty small.

Way Too Many Tiny Requests

You know what I think this needs? A hundred times as many requests, just to check.

Will the graph be beautiful beyond reason? Not so much. Right now I’m using ApacheBench’s CSV output, which already just gives the percentages like the ones on the graphs - so a million-request output file looks exactly like a 10,000-request output file, other than having marginally better numbers in it.

Still, we’ve shown that the output is somewhat stable run-to-run, at least on Ubuntu. Let’s see if running a lot more requests changes the output much.


That’s one of the 10k-request graphs from above on the left, with the million-request graph on the right. If you don’t see a huge amount of difference between them… Well, same here. So that’s good - it suggests that multiple runs and long runs both get about the same result. That’s good news for looking at 10,000-request runs and considering them at least somewhat representative. If I was trying to prove some major point I’d run a lot more (and/or larger) samples. But this is the initial “sniff test” on the benchmarking method - yup, this at least sort of works.

It also suggests that none of the Rubies have some kind of hidden warmup happening where they do poorly at first - if the million-request graph looks a lot like the 10,000-request graph, they’re performing pretty stably over time. I thought that was very likely, but “measuring” beats “likely” any day of the week.

I was also very curious about Ruby 2.0.0p0 versus 2.0.0p648. I tend to test a given minor version of Ruby as though they’re all about the same speed. And looking at the graph, yes they are — well within the margin of error of the test.

Future Results

This was a pretty simple run-down. If you look at the code above, none of it’s tremendously complicated. Feel free to steal it for your own benchmarking! I generally MIT-license everything and this is no exception.

So yay, that’s another benchmark just starting out. Where will it go from here?

First off, everything here was single-threaded and running on WEBRick. There’s a lot to explore in terms of concurrency (how many requests at once?) and what application server, and how many threads and processes. This benchmark is also simple enough I can compare it with JRuby and (maybe) TruffleRuby. Discourse just doesn’t make that easy.

I’ve only looked at Rails, and only at a very trivial route that returns a static string. There’s a lot of room to build out more interesting requests, or to look at simpler Rack requests. I’ll actually look at Rack next post - I’ve run the numbers, I just need to write it up as a blog post.

This benchmark runs a few warmup iterations, but with CRuby it hardly makes a difference. But once we start looking at more complicated requests and/or JRuby or TruffleRuby, warmup becomes an issue. And it’s one that’s near and dear to my heart, so expect to see some of it!

Some folks have asked me for an easier-to-run Rails-based benchmark which does a lot of Ruby work, but not as much database access or I/O that’s hard to optimize (e.g. not too many database calls.) I’m working that direction, and you’ll see a lot of it happening from this same starting point. If you’re wondering how I plan to test ActiveRecord without much DB time, it turns out SQLite has an in-memory mode that looks promising — expect to see me try it out.

Right now, I’m running huge batches of the same request. That means you’re getting laser-focused results based on just a few operations, which gives artificially large or small changes to performance - one tiny optimization or regression gets hugely magnified, while one that the benchmark doesn’t happen to hit seems like it does nothing. Running more different requests, in batches or mixed together, can give a better overall speed estimate. RRB is great for that, while this post is effectively a microbenchmark - a tiny benchmark of a few specific things.

Related: ApacheBench CSV summary format is not going to work well in the long run. I need finer-grain information about what’s going on with each request, and it doesn’t do that. I can’t ask questions about mixed results very well right now because I can’t see anything about which is which. That problem is very fixable, even with ApacheBench, but I haven’t fixed it yet.

I really miss the JSON format I put together for Rails Ruby Bench, and it’s going to happen sooner rather than later for this. ApacheBench’s formats (CSV and GNUplot) are both far less useful. So that’s going to happen soon too.

And oh man, is it easy to configure and run this compared to something Discourse-based. Makes me want to run a lot more benchmarks! :-)

What Have We Learned?

If you’ve followed my other work on Ruby performance, you may see some really interesting differences here - I know I do! I’m the Rails Ruby Bench guy, so it’s easy for me to talk about how this is different from my long-running “real world” benchmark. Here are a few things I learned, and some differences from RRB:

  • A tiny benchmark like this measures data transfer more than Ruby’s own performance

  • Overall, Rubies are getting faster, but:

  • A microbenchmark doesn’t show most of the optimization that each Ruby does, which looks a bit chaotic

  • ApacheBench is easy to use, but it’s hard to get fine-grained data out of it

  • Rails performance is pretty quick and pretty stable, and even 2.0.0p0 was decently quick when running it

I also really like that I can write something new and then speed-test it “historically” in one big batch run. Discourse’s Ruby compatibility limits make it really hard to set that kind of thing up for the 2.0 to 2.6 range, while a much smaller Rails app does that much more gracefully.

How Fast is the Released Ruby 2.6.0?

If you’ve been following me recently, there won’t be a lot of big shocks here.

I generally run Rails Ruby Bench, a big concurrent Rails benchmark based on Discourse, a high-quality piece of open-source forum software that uses Rails. I run 10 processes and 60 threads on an Amazon EC2 m4.2xlarge dedicated instance, then seen how fast I can run a lot of pseudorandom generated HTTP requests through it. This will all be familiar to you if you’ve read much here in the last couple of years.

Later this year there will be some new benchmark that doesn’t work that way. But for right now, let’s check out Ruby 2.6 with good old RRB and see how it stacks up.

On Christmas, Ruby 2.6.0 was released, following its release candidates, which I also speed-tested.

Another Test, Another Graph

The short version is: plain, JIT-less Ruby 2.6.0 is about the same speed as 2.5.3, or maybe just slightly faster. But it’s close enough that it’s hard for me to measure the difference, so I’m going to say “same speed.” It’s unlikely that it’s a full 2% faster (or slower) for instance. And running the benchmark at the accuracy below takes all day, so telling for sure is probably a two- or three-day benchmark run to accurately tell the difference. It’s very similar.

Here are those numbers:

You may get deja vu if you looked at the rc1 and rc2 graphs.

You may get deja vu if you looked at the rc1 and rc2 graphs.

This isn’t bad. Like with rc1 and rc2, the results were very stable - no 500s, no segfaults. Those occasionally occur just randomly, and more on some EC2 instances than others, and I exclude them from the results. But in this case the benchmark just quietly churned away for a whole day without a hiccup on any of the tested Ruby versions - this was a stable, (good kind of) boring test.

JITless 2.6.0 looks a bit faster on this test. But again, it’s hard to tell and these numbers are very close. That Y axis starts at around 47, seconds and the slowest runs are around 55 seconds, not counting the odd bump at the high end of the 2.5.3 numbers. That may have been one random bad run, or it may be that 2.5.3 is slower than 2.5.0 in some cases - this is the first time I have specifically run 2.5.3 as opposed to 2.5.0. Either way, it’s a very small effect, and it doesn’t seem to be present in 2.6.0.

The big difference is with JIT. As of 2.6.0preview3 it looked like JIT wasn’t too far off from JITless performance - maybe 10% or 15% slower? What we’re seeing here is much slower, more like 50% or 60%. Takashi knows about the regression, but it’s basically doing to be awhile before we see JIT helping Rails out. It’s just not there yet. He’s working on it.

Conclusions

For Rails Ruby Bench, 2.6.0 has been a solid, unexciting release - no real Rails speedup, or perhaps a tiny one. The stability is good. JIT’s not useful for big Rails apps yet.

To see more about how 2.6 and JIT stack up we’ll need to look at smaller benchmarks. I have some of that planned, and you’ll see it over the next few months — and at RubyKaigi, if they accept my talk proposal. I have some interesting numbers gathered, and many more to come.

For this year, I’m trying to get my release schedule on a simple track - one post every two weeks, written and scheduled ahead of time. I tried weekly, and it’s just too much. But I feel like last year was a pretty darn good writing year, and it came to almost exactly one post every two weeks. I have a good feeling about this.

Talk to you in two weeks!

A Short Update: How Fast is Ruby 2.6.0rc1?

Christmas approaches. The new Ruby release will be soon. 2.6.0-rc1 has dropped. It hasn’t changed that much since I reviewed preview3, but let’s have a quick look at it. Some of the timings have changed in interesting ways. Or boring ways, perhaps, but in a good way.

Quick Results

The JIT is absolutely, 100%, not faster for Rails yet. In fact, for whatever reason, it seems much slower than in preview3. On the other hand it doesn’t have that weird lumpy performance graph from last time - it’s slow, but it’s uniformly and predictably slow (see below.)

Remember how Ruby 2.5.0 had a nice little speed boost over Ruby 2.4? I’m not seeing that with 2.6. It really looks like Ruby 2.6 and 2.5 are the same speed. I actually got 2.6 looking very slightly slower in my measurements (see the graph.) But it’s within the margin of error — and as you can see, far closer together than Ruby 2.4.1 and 2.5, also shown below.

On the plus side, I saw no more segfaults or interpreter errors (some of those happened with preview3.) In my trials, Ruby 2.6 was rock solid, with or without JIT. I suspect some optimizations got removed or temporarily turned off for stability reasons — I know of that happening in at least one case, and there are probably others.

Here’s the raw version:

Check the Y axis - 2.5 is 5%+ faster than 2.4, but 2.6 and 2.5 are nearly identical… Unless you turn on JIT.

Check the Y axis - 2.5 is 5%+ faster than 2.4, but 2.6 and 2.5 are nearly identical… Unless you turn on JIT.

Takeaways

  • Ruby 2.6 MJIT is still very much not ready for Rails yet; Rails looks unlikely to get a speed boost from this Ruby release

  • The stability problems of 2.6preview3 have been fixed

  • 2.6 is the same speed as 2.5 without JIT

  • My graphs are roughly 30% prettier than a year ago

An Even Shorter Update:

I tested 2.6.0rc2, which came out this past weekend (around Dec 15th,) and it’s nearly identical:

You’ll note that 2.5.0 and 2.6.0 switched places at the bottom - but they’re both still within the margin of error. If that’s an actual speed difference at all, it’s a very small one.

You’ll note that 2.5.0 and 2.6.0 switched places at the bottom - but they’re both still within the margin of error. If that’s an actual speed difference at all, it’s a very small one.


Multiple Gemfiles, Multiple Ruby Versions, One Rails

As part of a new project, I’m trying to run an app with several different Ruby versions and several different gem configurations. That second part is important because, for instance, you want a different version of the Psych YAML parser for older Rubies, and a version of Turbolinks that doesn’t hit a “private include” bug, and so on.

For those of you that know my current big benchmark, you know I try to keep the same version of Rails and multiple Ruby versions to measure Ruby optimizations. This new project will be similar that way.

So, uh… How do you do that whole “multiple Gemfiles, multiple Rubies” thing at this point?

Let’s look at the options.

Lovely, Lovely Tools

For relative simplicity, there’s the Bundler by itself. It turns out that you can use the BUNDLE_GEMFILE environment variable to tell it where to find its Gemfile. It will then add “.lock” to the end to use as the Gemfile.lock name. That’s okay. For multiple Gemfiles, you can create a whole bunch individually and create lockfiles for them individually. (There’s also a worse variation where you have a bunch of directories and each just has a ‘Gemfile.’ I don’t recommend it.)

Also using Bundler by itself, there’s the Gemfile.common method. The idea is that you have a “shared” set of dependencies in a Gemfile.common file, and each of your Gemfiles calls eval_gemfile “Gemfile.common”. If you want to vary a gem across Gemfiles, pull it out of Gemfile.common and put it into every individual Gemfile. The bootboot gem explains this one in its docs.

Speaking of which, there’s the BootBoot gem from Shopify. It’s designed around trying out new dependencies in an alternate Gemfile, called Gemfile.next, so you can see what breaks and what needs fixing.

There’s a gem called appraisal, far more complicated in interface than BootBoot, that promises a lot more functionality. It’s from ThoughtBot, and seems primarily designed around Rails upgrades and trying out new sets of gems for different Rails versions.

And that was what I could find that looked promising for my use case. Let’s look at them individually, shall we?

My Setup

The basic thing I want to do is have a bunch of Gemfiles with names like Gemfile.2.0.0-p648 and Gemfile.2.4.5. I could even make do with just one Gemfile that checked the Ruby version as long as it could have separate Gemfile.lock versions.

But I’m setting up a nice simple Rails app to check relative speed of different Ruby versions. As a side note, did you know that Rails 4.2 supports a wide variety of Rubies, from 2.0-series all the way up to 2.6? It does, at least so far for me. I’m specifically thinking of Rails 4.2.11, though you can find lots of nice partial compatibility matrices if you need something specific. And the upper bounds aren’t a guarantee, so Rails 4.2.11 is working fine with Ruby 2.5.3 at the moment, for instance.

So: let’s see what does what I want.

BootBoot

This one was easy for me to try out… but not for useful reasons. It only supports two Gemfiles, not a variety for different Rubies. So it’s not the tool for me. On the flip side, it’s very well documented and simple. So if this is what you want (current Gemfile, future speculative Gemfile) it seems like it would work really well.

But pretty obviously, it doesn’t do what I want for this project.

Appraisal

I got a lot farther testing this one. Appraisal allows a number of different Gemfiles (good) and overriding gems that are in the Gemfile (very good!).

You wind up with a bit of a cumbersome command line interface because you have to specify which appraisal (i.e. variation) you want for each command. But that’s not a huge deal.

And I loved that you could put the differences into multiple blocks in the same file, so you could really easily see that, e.g. Ruby 2.0.0 needed a specific Psych version, while all earlier Rubies needed an earlier Turbolinks.

The dealbreaker with Appraisal, for me, is that you can’t specify a specific variation when you install the gems. It needs to look through all the appraisals at once and install them all at once. It’s fast, so that’s no problem. But that means I can’t specify a different Ruby version for the different variations, and that’s the whole reason I’m doing this.

If you were varying a different gem version (e.g. Rails,) appraisal is a really interesting possibility. It has some capabilities that nothing else here has like overriding gems that are in the shared Gemfile - nothing else here can do that. But having to do all its calculations about what to install in a single command makes it harder to use it for multiple Ruby executables — such as multiple CRuby versions, or CRuby versus JRuby.

What Did I Wind Up With?

Having tried and failed with the more interesting tools, let’s look at the approach I actually used - Gemfile.common. It’s good, it’s simple, it does exactly what I want.

Here’s an example of me using it to install gems for Ruby 2.4.5 and then run a Rails server:

BUNDLE_GEMFILE=Gemfile.2.4.5 bundle install
BUNDLE_GEMFILE=Gemfile.2.4.5 rails server -p 4321


It’s pretty straightforward as an interface, if a little bit verbose. Luckily I’m usually calling it from a script in a big loop, so I don’t have to manually type it much. You can also export the variable BUNDLE_GEMFILE, but that’s not a good idea in my specific case.

Here’s one of the version Gemfiles:

ruby "2.3.8"

eval_gemfile "Gemfile.common"

As you can see, it doesn’t even have a “source” for RubyGems. More to the point, any line needs to be in Gemfile.common or Gemfile.<version> but it cannot be in both. The degenerate form of this is to just have a bunch of separate Gemfiles and update them all every time anything changes, which I try to avoid.

You can also put in an extra gem or two if needed:

# Gemfile.2.0.0-p648
gem "psych", "=2.2.4"
ruby "2.0.0"

eval_gemfile "Gemfile.common"  # must not contain gem "psych" or ruby version!

So that’s pretty straightforward. After I run Bundler I get versioned Gemfile.lock files. And of course I check them in - they’re Gemfile.lock, after all.

Does That Mean Gemfile.lock Tools Are Always Bad?

Not at all! I’d say there are two big takeaways here.

One: at this point, Bundler does a lot of what you want it to do. It has better support for Platforms, and BUNDLE_GEMFILE is a powerful, versatile tool. So for simple or unusual cases, Bundler is a good tool to do this.

Two: various tools for this tend to be specific, not general. Appraisal is great for what it does. BootBoot is a specific, simple tool for a common use case. But neither one is designed for random use cases, even random “I want more than one Gemfile.lock” use cases. For that, the Bundler is your go-to common denominator.

How Fast is Ruby 2.6.0preview3 for Discourse?

As many of you here know, I speed-check a lot of Ruby versions. I use a big benchmark called Rails Ruby Bench - basically, it sets up a highly-concurrent Discourse/Puma instance with 10 processes and 60 threads, then runs a lot of repeatably-random-generated HTTP requests through it, and times the results.

The idea is that it’s a “real world” Rails benchmark. When somebody says “Ruby version so-and-so gives 50% better performance on this new microbenchmark!”, the response always starts with, “yeah, but what does that mean in terms of real-world Rails performance?” I like to think the Rails Ruby Bench results are a pretty good indicator. So let’s see how well 2.6 does compared to 2.5, shall we?

What Changed?

First off, why would we expect 2.6 to be any different at all? What changed?

For starters, Aaron Patterson made a couple of memory changes, which save Rubyists some bytes. In Rails Ruby Bench, memory savings sometimes turn into speedups due to how garbage collection and caches work. It will always use “all the memory” (the EC2 instance’s full allotment,) but often it’ll go faster if it has more memory to spare.

Koichi Sasada also wrote some patches to use a “transient heap” for certain kinds of variable creation in order to speed up creating and destroying short-lived objects. HTTP requests tends to have a lot of short-lived objects.

As always, there are lots of random minor speedups, which is basically true on every release. But many of them won’t make any difference in a big Rails app, which is rarely CPU-bound. We’ll evaluate them collectively. But OptCarrot is often a better choice to see how much they help.

What Didn’t?

There’s one major change in 2.6 that needs a disclaimer: JIT. If you’ve been following 2.6 at all, you know that it includes the brand-new JIT implementation called MJIT… which is off by default and has to be manually turned on.

In the case of Rails, you shouldn’t turn it on. It slows things down rather than speeding them up. Basically, JIT isn’t finished and Rails is too big for the current implementation to handle it well.

Now: we’re totally going to speed-test it anyway, because have you met me? I like graphs. There will be another line on the graph. Of course there will. However, you should expect it to be worse, not better, than the 2.6 line with no JIT.

The question is mostly about how close the JIT line is to the non-JIT line, because that may tell us how close we are to JIT catching up and surpassing non-JIT (fully interpreted) Rails code. After it does that, it can start to make optimizations.

There are some other really interesting Ruby 3x3 changes that aren’t here yet - I think of Koichi’s Guilds implementation, for instance. We won’t be testing that.

Results and Versions

I found several bugs while doing this - that happens with prerelease Rubies. RVM doesn’t yet support mounting 2.6.0 preview3 from a local build properly since it’s not putting all the right stubs in place. You can install it just fine with “rvm install 2.6.0-preview3”, which is all most people want anyway. I just install Rubies in a weird way.

And it turns out that Ruby 2.6.0preview3 has a periodic interpreter internal error (think: segmentation fault) with JIT and Discourse, which made it difficult to test with JIT. More on that later.

So I wound up also testing a slightly earlier Ruby head-of-master version with a less-severe interpreter error. It’s marked as “pre-bundler” here because it’s before the Bundler was merged in, which also let it be installed from source and mounted by RVM. I found a way to not stop the test for that, but the “pre-bundler” JIT numbers are pretty suspect and have a higher variance than I’d like. Don’t take them as gospel.

What is this testing? Each of these tests is about half a million HTTP requests, divided among 50 batches. Each 10,000 requests in a batch is divided between 30 load-tester threads (around 333 req/thread) and processed by cluster-mode Puma running with 60 threads in 10 processes.

Yeah, okay, but how fast is it? Let’s have some graphs!

This was my first graphed version: I started up two consecutive EC2 instances, and tested the “pre_bundler” commit and (on the second instance) 2.6pre3. What I saw was… odd.

Screen Shot 2018-11-29 at 10.35.15 AM.png

So what’s going on here? Well, the 2.5/2.6 story is a bit strange, but mostly they coincide. We’ll look at that more later. The JIT/no-JIT story is more interesting to me.

That yellow line with the weird slowdowns for most runs? That’s the pre-bundler JIT branch trying to handle RRB. You know what that looks like to me? It looks like Takashi, as he works on JIT, is fixing problems… and he’s only fixed all the problems for 45% of the runs. The other 55% of runs have at least one, and sometimes multiple, big weird slowdowns still. If you just look at the final numbers, you wind up believing that JIT is about 10% slower than non-JIT for Discourse. Which is, overall, true. But that graph up there shows that it’s not a simple 10% slower. Over half of all total runs are basically as fast with JIT as without it. A few are faster. But then the slow ones are often much slower, up to around twice as slow for the whole run combined.

(To answer your question in advance: I do not currently know what the slow runs have in common that the fast ones do not, and I should study that. Weirdly, the answer does not seem to be “a small number of really slow requests.” The single-request graph is surprisingly boring, so I’ve omitted it. So on some runs, all the requests seem to be somewhat slower. Is any of this related to that weird segfault? Maybe. The way it manifested kept me from keeping accurate records of exactly where it happened, which doesn’t help.)

The bottom orange line is the one to compare the JIT line to - it’s also the “pre-bundle” Ruby, not the released 2.6.0 preview 3. It seems to have had a weird slowdown as well, that only affected the top 4% or so of requests.

Also, keep in mind that the bottom three lines (everything but 2.6 pre-bundler w/ JIT) are much closer together. That Y axis starts around 45, not zero, so every run there is between about 45 seconds and 60 seconds to process a few hundred HTTP requests.

The lines for 2.5.0 and 2.6.0pre3 are much smoother - I don’t see any weird slowdowns. That makes sense. They’re polished Ruby releases and they’ve gotten a lot more love than random commits from head-of-master.

Okay, but why is 2.5 (arguably) faster than 2.6? I mean, that’s weird, right?

Yeah, But It’s a Statistical Artifact

There are two things going on with the lines for 2.5.0 versus 2.6 preview3.

One: check the Y axis. Those lines are actually very close together, well within 10% and usually much closer. It’s a small difference that looks big on that graph.

Two: I used two different EC2 instances. Yes, they were both dedicated m4.x2large instances, which give shockingly steady results over time in my experience. However, they do not give equally steady results across all instances, though it’s still not bad. The graph above is combining two different instances’ results for 2.5.0 (only) and comparing it with results from only one batch of 2.6.0 pre3. So let’s look at only one instance’s 2.5-versus-2.6pre3 results, filtering out the other instance’s results.

This is what that looks like:

Screen Shot 2018-11-29 at 10.51.51 AM.png

It tells a very different story, doesn’t it? This basically says “2.6.0pre3” is very slightly faster, across basically all requests. That difference is within a single standard deviation on my test so I’m not going to give you a percentage - it would be a very small one. But it does look consistently (very) slightly faster rather than slower, so that’s probably good.

Why no 2.6-pre3-with-JIT line? That would be the nastier version of the segfault, the one that kept me from successfully measuring with-JIT performance at all for that Ruby version on that instance. I tried measuring it separately, ignoring all runs with segfaults, and got… weird results. Given that we know JIT isn’t supposed to be good for Rails at this point, I’m going to stop speculating on exactly what’s going on there. But the results are a bit weird, even if you cut out the ones with internal errors in the interpreter.

Takeaways

Short version: 2.6.0pre3 is maybe a little faster than 2.5.0. But for big Rails apps, that difference is somewhere between “barely detectable” and “undetectable” without JIT. The impressive thing will be when JIT gets good enough to make a real difference for larger applications. And we’re not there yet. In fact right now for this prerelease, JIT is a bit unstable.

A little memory savings and a few miscellaneous fixes have happened. But it’s hard to make a big I/O-bound Rails app faster. Ruby’s improving, but it can’t work miracles.

With that said, your old Rails apps are still getting faster, and that will keep happening. Every year is a little extra free performance boost. This year may be a performance boost for only your small apps, not your big Rails apps.

Bundler is Built Into Ruby 2.6.0preview3

Big Bundler changes are coming for Ruby 2.6 preview 3. No, not the really huge RubyGems 3 and 4 changes. Also not the Bundler 2.0 changes where Gemfile changes name to gems.rb. Those are still in the future, mostly.

No, preview3 is where Bundler got merged into Ruby proper. They’ve been working on it for awhile. When you build the Ruby source code, you get a Bundler executable right inside Ruby. It’s a lot like rdoc or irb now. It can also have better integration with RubyGems, which has been part of core Ruby since Ruby 1.9.

You could be joining your relatives to eat Thanksgiving leftovers as you listen to Uncle Bob’s highly-political take on the US President tear-gassing asylum seekers, or you could be reading arcane Bundler minutiae. I think we both know which is more pleasant.

Some Early Bugs

As you’d expect, there are a few bugs to iron out. While rvm merged a PR for preview3, they didn’t change any of their stubs, which may be interesting in the long term - do you need to install a Bundler gem even though Bundler is built-in? What if they’re different versions?

Rbenv and Ruby-build also allow installing it — I’m not sure they need any special treatment for it, given the way they’re different from rvm.

(For either RVM or ruby-build, you may need to update before installing the new one. That's how you usually make new versions available. And this is a very new version.)

It’s also possible to hardcode some of your Bundler assumptions in a way that gets broken (as, ahem, I do in Rails Ruby Bench.)

Also, their new version numbers seem to be things like “2.a”? Some of the changes are a bit confusing to me.

In general, this is a great time to try upgrading to 2.6.0 preview3 and see whether you see any Bundler-related breakage.

Installing

I use MacOS on my personal laptop, so I’m going through the joys of getting Ruby to use Homebrew’s OpenSSL 1.1 with 1.0 still installed. In other words, mostly it breaks. Here’s what I do with RVM:

rvm install 2.6.0-preview3 -C --with-openssl-dir="$(brew --prefix openssl)"

You can do something very similar in Ruby-Build or rbenv:

RUBY_CONFIGURE_OPTS=--with-openssl-dir="$(brew --prefix openssl)"

Right now RVM insists on installing OpenSSL 1.1, but Ruby doesn’t seem to build with it. OpenSSL has been a giant pain for MacOS (among others) for as long as I can remember. So, y’know, whatever your current coping strategy is, you can use it here too. Mine is only whining in blog posts because I don’t do whiskey.

What It’s Do?

Having both built-in and installed Bundler is likely to be weird… And also very, very common. Below is what I saw when I did that.

First, I built Ruby 2.6.0preview3, which has the new built-in Bundler. I checked the version - and it worked. Yay!

C02RP0G1G8WM:opt noah.gibbs$ bundle --version
Bundler version 1.17.1

Okay, so what if I install Bundler as a gem? And with a lower version?

C02RP0G1G8WM:opt noah.gibbs$ gem install bundler -v 1.17.0
Fetching bundler-1.17.0.gem
Successfully installed bundler-1.17.0
Parsing documentation for bundler-1.17.0
Installing ri documentation for bundler-1.17.0
Done installing documentation for bundler after 2 seconds
1 gem installed
C02RP0G1G8WM:opt noah.gibbs$ bundle --version
Bundler version 1.17.0

Interesting! The lower-version gem takes precedence. Presumably that’s due to how RVM and paths work. Can we use the Bundler version-specific stub hack to use a specific version?

C02RP0G1G8WM:opt noah.gibbs$ bundle _1.17.0_ --version
Bundler version 1.17.0
C02RP0G1G8WM:opt noah.gibbs$ bundle _1.17.1_ --version
Traceback (most recent call last):
	2: from /Users/noah.gibbs/.rvm/gems/ruby-2.6.0-preview3/bin/bundle:23:in `
' 1: from /Users/noah.gibbs/.rvm/rubies/ruby-2.6.0-preview3/lib/ruby/2.6.0/rubygems.rb:307:in `activate_bin_path' /Users/noah.gibbs/.rvm/rubies/ruby-2.6.0-preview3/lib/ruby/2.6.0/rubygems.rb:288:in `find_spec_for_exe': can't find gem bundler (= 1.17.1) with executable bundle (Gem::GemNotFoundException)

Basically yeah, we can. The built-in 1.17.1 wasn’t installed the same way, and so it doesn’t have a version-specific stub. It’s not a gem, it’s a built-into-Ruby executable like irb or rdoc. And in fact, if we specifically use that binary, we get the built-into-Ruby version of Bundler, not the gem:

C02RP0G1G8WM:opt noah.gibbs$ /Users/noah.gibbs/.rvm/rubies/ruby-2.6.0-preview3/bin/bundle --version
Bundler version 1.17.1

That makes sense.

Does it work if I uninstall the gem?

C02RP0G1G8WM:opt noah.gibbs$ gem uninstall bundler
Remove executables:
	bundle, bundler

in addition to the gem? [Yn]  Y
Removing bundle
Removing bundler
Successfully uninstalled bundler-1.17.0
C02RP0G1G8WM:opt noah.gibbs$ bundler --version
Bundler version 1.17.1

Looks good!

What’s My Takeaway?

In no particular order:

  • As of Ruby 2.6.0preview3, Bundler is part of core Ruby

  • You can still install Bundler as a gem, and it basically works

  • If you have a nice new Bundler but it’s getting an old one instead, uninstall the old gem

  • There will be Bundler bugs in the new year - this change is a good first place to look

  • Instead of joining your family for holiday conversation, consider testing code with new Ruby, reading lots of my old blog posts, getting unsociably drunk or really anything else… Enjoy the news responsibly and in moderation, though.

Have a joyous holiday season, for a holiday of your choice! I wish you many new Bundler and Ruby features in the coming year.

Ruby 3x3 and RubyConf Los Angeles

I’m fresh back from RubyConf in Los Angeles. And Keep Ruby Weird. Also, barely returned from, and just wrote an article about, RubyConf Malaysia. Have I mentioned that I’ll be traveling a lot this next year, too?

I’ve just talked to a lot of Rubyists. I’ve learned a few things, including about Ruby 3x3. Let’s talk about where that is, shall we?

Ruby Speed

I continue to update and run Rails Ruby Bench. Speed is one of my big interests. Let’s talk about how Ruby’s speed is doing.

The JIT’s good and getting better. Takashi Kokubun keeps working on it constantly. It’ll be in the Ruby 2.6.0 Christmas release, and it was also in all the recent Ruby preview releases. Method inlining, one of the big speed benefits of JIT, is nearly here! It wasn’t in preview3, but it sounds like it’ll be there for Christmas. You can see more about the current state of Ruby 2.6 JIT in Takashi’s slides from RubyConf (current as of Nov 2018.)

Wondering if Ruby 3x3 will actually be three times faster than Ruby 2.0? Those same slides put OptCarrot at 2.53x faster with the current changes. I think we’ll make it to 3x!

The major JIT disclaimer is Rails. Currently Ruby 2.6 JIT makes Rails slower. Takashi has been working on it, but there are some hard problems there. He’s also collecting other benchmarks where JIT makes code slower to fix similar cases.

Progress has been good. I learned from Charles Nutter and Tom Enebo’s RubyConf presentation that for a simple “just CRUD with scaffolded actions” Rails app, 2.6 with JIT is very nearly the same speed as 2.6 without JIT. So Takashi’s work has helped, it’s just not quite there yet.

(Not as fast as JRuby, though. Those folks are constantly optimizing. When the recording of their RubyConf talk goes up, watch it.)

There have also been other speedups in 2.6, of course. Aaron Patterson continues to work hard on the memory system, including a couple of changes in Preview3 that reduce memory usage. For memory-limited scenarios like Rails Ruby Bench, that translates into extra speed - you should see a benchmark from me soon with the latest numbers for the Ruby 2.6 prerelease.

(Unrelated: did I mention that the RubyConf venue was kind of a palace? It was. The Millennium Biltmore in Los Angeles, if you want to look it up.)

How Much Do We Need Speed?

RubyConf is a great chance to survey Ruby folks and see where lack of speed is biting them. Not only did I go down the row of vendor companies asking, I asked a lot of random Rubyists. I also asked on Twitter. The answers surprised me a bit.

Short version: other than Rails, it looks like Ruby is mostly fast enough. Nobody complains about new speedups, but… Ruby just isn’t slowing people down, day-to-day. It has a reputation as slow. There may be people who don’t use Ruby for some speed-related reason. But existing Rubyists, who use Ruby now, don’t seem to hit speed problems with it.

Note that, again, I said “other than Rails.” That’s a large caveat.

Concurrency

Koichi Sasada has been working on Guilds for awhile, and has had several talks on his prototype implementation. The idea is neat. I’d love to see the GIL limitations broken without screwing up threading for new programmers. This is a feature that would primarily benefit concurrent and Rails performance, which is nice.

The code is finally available! You can also read more in his RubyConf slides.

Unfortunately, the performance isn’t great yet. This isn’t going to give multiprocess Rails a run for its money, performance-wise… yet. Koichi is looking at some of the tradeoffs of the current design. And Guilds aren’t likely to ship in Ruby 2.6 this Christmas. The design isn’t fully nailed down, and there are still some bugs in the current implementation.

But we have a current implementation to play with. Progress!

(My bear is named the Super Princess. She makes friends easily. Now you know!)

Type Checking

Matz has been talking about gradual typing in Ruby for awhile here - it’s one of the three big pillars of Ruby 3x3, along with concurrency and performance.

Like concurrency, there’s still some design in progress. They’re still having design meetings about it and refining plans. There have been several early prototype implementations of different designs, and they’re still at it. The “TypeDB” ideas from this year’s RubyKaigi sounded promising.

Matz’s big design goal here is that no new type information will be required, but new tooling can find more bugs. A TypeScript-style additional type file is likely, but will always be optional. And Matz really hates type annotations, so those aren’t going to happen.

At RubyKaigi in May they were talking about a “Type Database” file that would collect different type information from different tools - for instance, you could run unit tests in a special mode that would record what types each method took. And you could run YARD or similar docs tools to add the documented types to the database. And you could run a static analysis tool and see what it could tell about the appropriate types for each call site. In Ruby, each of these methods is limited. But all of them together can find a lot of bugs.

The tooling for this is all early prototypes as far as I know. I can’t even provide you a link - I’ve only seen it mentioned briefly in talks.

Yeah, But When?

In the Q&A with Matz at the end of RubyConf, he said to expect Ruby 3x3 around Christmas of 2020. I think we’ll be three times faster before that point - probably well before Christmas of 2019, at the current rate. The 2020 release will likely have Guilds in some form, but I wouldn’t be surprised if they’re still a little rough. And there will be some form of type checking tool. It’s hard to be sure what that will look like for that release, though.

In practice, you can expect all of these features to arrive a little at a time. Performance is nearly here. Guilds are here but rough. Types are barely here at all. And all of these will keep slowly improving.

RubyConf Malaysia and Getting the Most from a Distant Conference

I had a great trip to RubyConf MY — thanks for inviting me, Tevanraj! I won’t subject you all to a travel post about Kuala Lumpur, even though it’s awesome. I will talk about some interesting Ruby and development stuff from the conference and before. I’ll also talk about how to get more from a conference far from home.

Kuala Lumpur is a city of gigantic, awe-inspiring buildings. The constant construction goes way above where most cities stop, vertically speaking. Also, click on any other image in this post for bigger pics.

Kuala Lumpur is a city of gigantic, awe-inspiring buildings. The constant construction goes way above where most cities stop, vertically speaking. Also, click on any other image in this post for bigger pics.

Showing Up Early Can Be a Great Way to Meet Developers

If you show up early or stay late, you can potentially meet speakers, locals, expats and so on. Michael Kohl was briefly in Malaysia rather than Thailand, and I got to hang out with him a bit before the conference. Thanks, Michael! We talked about how his consultancy uses Rails in slightly different ways than the standard out-of-the-box experience, a bit better for experts and a bit less beginner-friendly. It makes sense that we all evolve a style over time, and he had some interesting ideas about how to scale Rails to more complex use cases. If you get a chance to talk to him, maybe online, he has some great ideas about that!

I made it to one local Malaysian meetup. It was a DevOps meetup rather than specifically Ruby, but still a great experience. MindValley sponsors a lot of local development stuff, including RubyConf MY and hosting a lot of different meetups - so going to a meetup there was a great way to see an important piece of the local tech scene.

A neat thing about going: seeing what’s the same and what what’s different. Everybody was talking about the same cloud providers (AWS, Google Compute, Azure) in slightly different amounts (more Azure, very little Google.) The talks were about the same technologies we’re excited about in California (Kubernetes, serverless including Lambda.) More people were working at freelance, consulting and contracting companies, and a lot fewer at tiny semi-insane product companies. I feel pretty confident about our local speakers and SREs — California deserves a lot of its reputation, you know? But the communities aren’t so different.

And the venue could have been in Mountain View or SF. A huge floor of beanbag chairs, surrounded by Avengers models and toys, with a list of company values on the wall that could have been from a California startup just as easily.

If you head to a conference far from home, there’s a lot to be understood. Partly, it’s worth taking some extra time to look around and talk to people. At first, you don’t even know what to look for, so just look around.

Conference Culture Varies, Too

Malaysia was an interesting conference experience: it was hard to get the attendees to talk much to the speakers.

It was mostly a deference thing, I think. I found a guy to talk to the morning of day one (hi, Joe!) and once he figured out I was a speaker, he got a lot quieter. He also thought it was very weird that I was just sitting somewhere in the audience, not right up front in a special section. I said that in the big US conferences, the up-front section was reserved for new folks and people guiding them, not as a high-prestige speakers-and-VIPs section. He seemed to think that was pretty weird too.

RubyKaigi in Japan had some of that deference, too, though not as much as Malaysia. One thing I love about US Ruby conferences is just how clear we make it: new people are our lifeblood, and we need them desperately. That’s… not everybody’s take on it. That makes sense. I don’t feel like most languages, libraries, etc are great about it either. Ruby makes very real technical sacrifices for new-folk-friendliness. It’s hard to imagine, say, C++ doing that.

So: if you’re going to a conference outside the US, or that might otherwise not be run like our main national conferences, it may be worth encouraging folks to talk to you (if you’re a speaker) or to talk to the speakers (if you’re not.) A lot of what people get from conferences is what can’t easily be recorded.

Local Flavor

One of the cool things about a distant conference: you’ll see speakers you otherwise wouldn’t. In Malaysia, the attendees were a pretty even mix of Malaysian, Indonesian and Vietnamese, plus a smaller number of others. The speakers had some classics and well-known speakers from the US circuit (e.g. Aaron Patterson, AllieP, Britt Martin, Nadia Odunayo) but also folks I don’t see as much. Ajey Gore from Go-Jek in Indonesia gave an amazing ending keynote. Janice Shiu of MindValley gave a great talk about algorithmic poetry and pronunciation. Ankita Gupta and Sean Nguyen’s talk on GraphQL was great. I could have seen some of these folks elsewhere — Ankita has spoken at RedDotRubyConf in Singapore, for instance. But it turns out there’s a lot going on that I’d miss. And hey, I haven’t made it to Singapore yet.

And since they’re at the conference, you can sit around and chat with excellent people you wouldn’t otherwise meet. I talked to Ajey a fair bit before his keynote and he’s great company. I like anybody who can talk both tech and business fluently, and he’s a powerhouse in both. But if you introduce yourself to conference folks (and you should!) then you’ll meet awesome people you otherwise wouldn’t… especially if it’s not a conference that’s local to you.

It’s also an excuse to do other stuff. I was lucky enough to be invited to see the Batu Caves with a couple of the other speakers. But when I’m just driving down to Los Angeles, it’s hard to convince myself to see tourist stuff. It’s not far away, you know? The farther from home you are, the better a reason to say “hey, let’s see that fun thing in the tourist guides.” Kuala Lumpur has a wide variety of beautiful places. But so do most cities that would host a conference, you know?

A Distant Conference is Still a Conference

A lot of what you get from being at a Ruby conference is talking to people and kick of inspiration. Great talks are great, but they get recorded. Great technical information is already in thousands of blog posts you can Google.

You may notice, basically, that this post is “go talk to people, go talk to people, go talk to people.”

For an excellent conference experience at any conference anywhere, may I recommend going and talking to people? It’s a good thing.

Traveling Ruby Conversation!

Hey, Rubyists!

I’m going to be traveling as I work for awhile. So expect announcements of interesting locations where I may be found. If you’d like to talk Ruby, I’m interested!

I’ll also try to contact local meetups in my various locations - I’d love to give talks or just hang out with the local folks!

I’m currently in Anaheim, California. Let me know if you’re nearby!

And I’ll be in Malaysia for RubyConf MY from October 15th-30th. Do I have any Malaysian readers?

Ruby Method Lookup, RubyVM.stat and Global State

In Ruby, it can sometimes be a bit involved figuring out where a constant or a method comes from - not just for you, but for Ruby, too! When you call "foo," is it foo from your current class? One of its parents? A module included from a parent class? Somewhere else?

And of course, Ruby has a few objects whose methods are available just about everywhere - Object, BasicObject and Kernel.

When I wrote about the Global Method Cache, we touched on that just a little. Let's go a bit deeper, shall we?

Better yet, we'll learn about some things that you should carefully *not* do to keep your performance good, and how you check.

Method Caching and Cache Invalidation

Methods on three specific Ruby objects are special - BasicObject, Object and Kernel. BasicObject is the root of the inheritance tree - even the simplest Ruby objects inherit from it. Object is slightly more full-featured than BasicObject, but it's basically the same thing - it includes a module called Kernel, which gives it a lot of methods. And Object is the default for inheritance, so nearly every object inherits from it. As a result, every object inherits from BasicObject and nearly every object inherits from Object, and includes Kernel. Also, any “top level” definitions are definitions on Object (thanks to Benoit Daloze for correcting my original explanation!)

As a result, they get special hardcoding in Ruby's performance code. Ruby keeps a count of how many times you have defined methods on those three objects. It calls that count your “Global Method State.” And it tags all method cache entries with that number. Which means that if you add a new method on any of them, all the old method cache entries get invalidated...

That's good! You don't want to use stale entries that would point to the wrong method definition.

Also, that's bad. All your old cache entries are gone, and now you have to look them up again. That can be slow.

If it happens during the setup at the beginning of your Rails app... Well, sure. That sounds like Rails, defining methods in all sorts of places. Any cache you set up before it's done with that is wasted, sure. Sounds like Rails. Also, sounds fine.

But if you do that in your inner loop, that's really bad. It means you're looking up all your methods fresh, every time, even methods that don't share a name with the method you're defining on Object (or Kernel, or BasicObject.) That's no good.

Aaron Patterson has also written more about Global Method State and its relatives, if you want more details.

Constants and Cache Invalidation: Global Constant State

Ruby has really involved constant lookup. In the same way as for global methods, making a new constant makes it hard to tell exactly what constant to use. Ruby has a really similar solution.

When you define a new constant, it invalidates your old constant caching - Ruby has to look everything up again. The state number Ruby uses to track this is called the Global Constant State.

Your Global Cache Detective: RubyVM.stat

In CRuby, you can't "fix" the cache-invalidation problem except by not defining methods on Object, Kernel or BasicObject in your inner loop. If you need to define new methods constantly, do it in some other class.

But how can you tell if you — or one of your dependencies — are doing that?

Remember Ruby's GC.stat? In the same way, Ruby has a RubyVM.stat that tracks changes to (what it calls) "global_method_state".

2.5.0 :002 > RubyVM.stat
 => {:global_method_state=>137, :global_constant_state=>1115, :class_serial=>7109}

Each of these tracks an internal quantity for the VM. :global_method_state is the one we’ve just been talking about. :global_constant_state is the counter for constants. And class_serial is complicated to explain — but basically, for each individual class, they keep a similar counter, and this number assigns the value across all classes. Unlike global_method_state, it’s not a big performance problem if you reset it. Mostly you can ignore class_serial.

Great! But How Do I Use It?

You might reasonably ask, “what would I do with this?” If you’re finding your app slows down unaccountably at some times, or you’re worried that it might, it’s one more thing you can check - has global_method_state increased a lot? Or has global_constant_state increased a lot? Either case might mean that you’re doing something slow that busts your caches. OpenStruct has had this problem, for instance (edit: fixed to say OpenStruct, not Struct - thanks, commenter!)

If you’re using Rails, you might consider doing this in a Rack middleware - if either of those increases during a request, that may be a sign that you’re using something slow and you’ll want to look into that.

Ruby's Main Object Does What?

Last week, Mischa talked about debugging a problem with Rake tasks polluting the global namespace. This week, I'll talk about how that happens.

Spoiler: there will be a bunch of spelunking, first in Ruby and then in Ruby's C source code. We'll talk about how to find code in both places.

What Are We Looking For?

When we define methods on Ruby's top-level "main" object, they show up as instance methods on Object so they're callable absolutely everywhere. But "main" is mostly just a random instance of Object, and isn't part of the standard class hierarchies like, say, Kernel or Object. So why and how do those methods show up on Object?

First I checked what was going on in irb. You don't know what you're looking for if you can't write an example! Here's what I did:

2.5.0 :001 > def bobo; print "Bobo!"; end
=> :bobo
2.5.0 :002 > class NotBobo; def really; puts "I am pretty sure."; bobo; end
2.5.0 :003?>   end
=> :really
2.5.0 :004 > a = NotBobo.new
=> #<NotBobo:0x00007fc0fe031940>
2.5.0 :005 > a.really
I am pretty sure.
Bobo! => nil

That bit where it prints "Bobo!" instead of giving a no-method exception? That's the feature we're talking about.

(I hadn't actually known this happened. How'd I miss that? If you already knew that, congratulations! This is a good time to feel superior about it ;-)

This is a good example of a feature that can be mysterious if you don't already know it. So let's talk about how you'd track this feature down, by talking about how I recently did do that.

Searching in Ruby

Ruby is a language with great reflection methods. So first, we'll check where that behavior could be coming from in Ruby.

The obvious places to look for weird behavior in Ruby are the object in question ("main" in this case,) and Object and Kernel.

Let's see what "main" actually is in irb:

2.5.0 :001 > self
 => main
2.5.0 :002 > self.class
 => Object
2.5.0 :003 > self.singleton_class
 => #<Class:#<Object:0x00007f9ea78ba2e8>>
2.5.0 :005 > self.methods.sort - Object.methods
 => [:bindings, :cb, :chws, :conf, :context, :cws, :cwws, :exit, :fg,
     :help, :install_alias_method, :irb, :irb_bindings, :irb_cb,
     :irb_change_binding, :irb_change_workspace, :irb_chws,
     :irb_context, :irb_current_working_binding,
     :irb_current_working_workspace, :irb_cwb, :irb_cws, :irb_cwws,
     :irb_exit, :irb_fg, :irb_help, :irb_jobs, :irb_kill, :irb_load,
     :irb_pop_binding, :irb_pop_workspace, :irb_popb, :irb_popws,
     :irb_print_working_binding, :irb_print_working_workspace,
     :irb_push_binding, :irb_push_workspace, :irb_pushb, :irb_pushws,
     :irb_pwb, :irb_pwws, :irb_quit, :irb_require, :irb_source,
     :irb_workspaces, :jobs, :kill, :popb, :popws, :pushb, :pushws,
     :pwws, :quit, :source, :workspaces]

Huh. That feels like a lot of instance methods on the top-level object, and a lot of them irb-flavored. Maybe this is somehow an irb thing? Let's check in a separate Ruby source file with no irb loaded.

# not_in_irb.rb
def method_on_main
  print "Bobo!"
end

class NotBobo
  def some_method
    print "Yup.\n"
    method_on_main
  end
end

a = NotBobo.new
a.some_method

print "\n\n\n"

print (self.methods.sort - Object.methods).inspect

Feel free to run it. But when I do, I get an empty list for the methods. In other words, that whole list of methods on main that aren't on Object came from irb, not from plain Ruby. Which seems like there's nothing terribly special there. Hrm.

What about the singleton class (a.k.a. eigenclass) for main? Maybe it has something individually that works only on that one object? Again, I'll run this outside of irb.

dir noah.gibbs$ cat >> test2.rb
print self.singleton_class.instance_methods
dir noah.gibbs$ ruby test2.rb
[:inspect, :to_s, :instance_variable_set, :instance_variable_defined?,
 :remove_instance_variable, :instance_of?, :kind_of?, :is_a?, :tap,
 :instance_variable_get, :public_methods, :instance_variables, :method,
 :public_method, :define_singleton_method, :singleton_method,
 :public_send, :extend, :pp, :to_enum, :enum_for, :<=>, :===, :=~,
 :!~, :eql?, :respond_to?, :freeze, :object_id, :send, :display,
 :nil?, :hash, :class, :clone, :singleton_class, :itself, :dup,
 :taint, :yield_self, :untaint, :tainted?, :untrusted?, :untrust,
 :trust, :frozen?, :methods, :singleton_methods, :protected_methods,
 :private_methods, :!, :equal?, :instance_eval, :instance_exec, :==,
 :!=, :__id__, :__send__]

Ah. There's a lot there, and I'm not finding it terribly enlightening. Plus, it's really likely whatever method I care about is going to be defined in C, at least in CRuby. Let's bit the bullet and check Ruby's source code...

No Luck - Let's Make More Luck

Okay. That pretty much exhausts our Ruby options. Beyond this point, it's time to check in C. I'll use the latest (August 2018) Ruby code, because this is a long-term feature and hasn't changed any time recently -- sometimes you'll need a very specific version of the Ruby code, depending what you're looking for.

So: first we're looking for the "main" object. The word "main" is used in lots of places in Ruby, so that will be hard to track down. How else can we search?

Luckily, we know that if you print out that object, it says "main". Which means we should be able to find the string "main", quotes and all, in C. I'm going to use The Silver Searcher, a.k.a. "ag", for code search here - you can also use Ack, rgrep, or your favorite other tool.

We can ignore anything under "test", "spec", or "doc" here, so I won't list those out.

thread.c
4936:    rb_define_singleton_method(rb_cThread, "main", rb_thread_s_main, 0);

object.c
3692: *     String(self)        #=> "main"

vm.c
3177:    return rb_str_new2("main");

addr2line.c
782:    if (line->sname && strcmp("main", line->sname) == 0)

lib/rdoc/generator/template/darkfish/index.rhtml
15:<main role="main">

lib/rdoc/generator/template/darkfish/servlet_root.rhtml
16:<main role="main">

lib/rdoc/generator/template/darkfish/servlet_not_found.rhtml
13:<main role="main">

lib/rdoc/generator/template/darkfish/page.rhtml
15:<main role="main" aria-label="Page <%=h file.full_name%>">

lib/rdoc/generator/template/darkfish/table_of_contents.rhtml
2:<main role="main">

lib/rdoc/generator/template/darkfish/class.rhtml
19:<main role="main" aria-labelledby="<%=h klass.aref %>">

iseq.c
742:    const ID id_main = rb_intern("main");

(...)

Okay. The one in object.c is on a comment line. The ones in the rdoc generator are classes on markup elements -- not what we're looking for. The one in thread.c is for the name of the main thread. Let's investigate addr2line.c, iseq.c and vm.c as the promising choices.

In addr2line.c it's messing with printed text in dumping a backtrace, not defining methods on the top-level object:

void
rb_dump_backtrace_with_lines(int num_traces, void **traces)
{
  /* ... */
    /* output */
    for (i = 0; i < num_traces; i++) {
        line_info_t *line = &lines[i];
        uintptr_t addr = (uintptr_t)traces[i];
        /* ... */
        /* FreeBSD's backtrace may show _start and so on */
        if (line->sname && strcmp("main", line->sname) == 0)
            break;

(By the way - in C, anything surrounded by the slash-star star-slash things are comments.)

In iseq.c, it's naming the types of instruction sequences -- not what we want:

static enum iseq_type
iseq_type_from_sym(VALUE type)
{
    const ID id_top = rb_intern("top");
    const ID id_method = rb_intern("method");
    const ID id_block = rb_intern("block");
    const ID id_class = rb_intern("class");
    const ID id_rescue = rb_intern("rescue");
    const ID id_ensure = rb_intern("ensure");
    const ID id_eval = rb_intern("eval");
    const ID id_main = rb_intern("main");
    const ID id_plain = rb_intern("plain");

Finally, in vm.c we find something really promising:

/* top self */

static VALUE
main_to_s(VALUE obj)
{
    return rb_str_new2("main");
}

VALUE
rb_vm_top_self(void)
{
    return GET_VM()->top_self;
}

That's more like it! And it's next to something being referred to as "top self", which sounds pretty main-like. So let's see where main_to_s gets used. I checked with ag, and it's only in vm.c:

void
Init_top_self(void)
{
    rb_vm_t *vm = GET_VM();

    vm->top_self = rb_obj_alloc(rb_cObject);
    rb_define_singleton_method(rb_vm_top_self(), "to_s", main_to_s, 0);
    rb_define_alias(rb_singleton_class(rb_vm_top_self()), "inspect", "to_s");
}

Cool. That looks useful - it's defining the main object's method "to_s", so we have the right object. It's saying that main is an instance of Object (called "rb_cObject" here) and defining to_s and inspect on it. That doesn't tell us anything else special about main... But knowing that it's called "top_self" does let us find other files that use main, so let's look for it.

Main, top_self, Ruby

If we search for 'top_self', we can see what we do with main. In fact, we can see everything Ruby does with the main object...

inits.c
24:    CALL(top_self);

eval.c
1940:    rb_define_private_method(rb_singleton_class(rb_vm_top_self()),
1942:    rb_define_private_method(rb_singleton_class(rb_vm_top_self()),

internal.h
1908:PUREFUNC(VALUE rb_vm_top_self(void));

vm_method.c
2131:    rb_define_private_method(rb_singleton_class(rb_vm_top_self()),
2133:    rb_define_private_method(rb_singleton_class(rb_vm_top_self()),

ruby.c
671:    VALUE self = rb_vm_top_self();

vm.c
466:    vm_push_frame(ec, iseq, VM_FRAME_MAGIC_TOP | VM_ENV_FLAG_LOCAL | VM_FRAME_FLAG_FINISH, rb_ec_thread_ptr(ec)->top_self,
2142:   rb_gc_mark(vm->top_self);
2443:    RUBY_MARK_UNLESS_NULL(th->top_self);
2574:    th->top_self = rb_vm_top_self();
3093:   th->top_self = rb_vm_top_self();
3101:   th->ec->cfp->self = th->top_self;
3181:rb_vm_top_self(void)
3183:    return GET_VM()->top_self;
3187:Init_top_self(void)
3191:    vm->top_self = rb_obj_alloc(rb_cObject);
3192:    rb_define_singleton_method(rb_vm_top_self(), "to_s", main_to_s, 0);
3193:    rb_define_alias(rb_singleton_class(rb_vm_top_self()), "inspect", "to_s");

vm_eval.c
1394:    return eval_string_with_cref(rb_vm_top_self(), rb_str_new2(str), NULL, file, 1);
1406:    return eval_string_with_cref(rb_vm_top_self(), arg->str, NULL, arg->filename, 1);
1474:    VALUE self = th->top_self;
1479:    th->top_self = rb_obj_clone(rb_vm_top_self());
1480:    rb_extend_object(th->top_self, th->top_wrapper);
1484:    th->top_self = self;
1516:       val = eval_string_with_cref(rb_vm_top_self(), cmd, NULL, 0, 0);

vm_core.h
596:    VALUE top_self;
870:    VALUE top_self;

lib/rdoc/parser/c.rb
476:      next if var_name == "ruby_top_self"

proc.c
3175:    rb_define_private_method(rb_singleton_class(rb_vm_top_self()),

load.c
577:    volatile VALUE self = th->top_self;
589:    th->top_self = rb_obj_clone(rb_vm_top_self());
591:    rb_extend_object(th->top_self, th->top_wrapper);
619:    th->top_self = self;
996:            handle = (long)rb_vm_call_cfunc(rb_vm_top_self(), load_ext,

mjit.c
1503:    mjit_add_class_serial(RCLASS_SERIAL(CLASS_OF(rb_vm_top_self())));

variable.c
2188:    state->result = rb_funcall(rb_vm_top_self(), rb_intern("require"), 1,

Since we're looking for what happens when we define a method on main, we can ignore some of what we see here.  Anything that's being initialized, we can skip. And of course, we can still ignore anything in doc, test or spec. Here's roughly how I'd summarize what I see in these files when I check around for top_self:

  • inits.c: initialization, like the name says
  • internal.h, vm_core.h: in C, files ending in ".h" are declaring structure, not code; ignore them
  • mjit.c: this is initialization, so we can skip it.
  • lib/rdoc/parser/c.rb: this is documentation.
  • load.c: this is interesting, and could be what we're looking for... except it happens only on require or load.
  • variable.c: this is only on autoload, and it just makes sure we autoload into the main object.
  • vm_method.c: this is defining "public" and "private" as methods on main. Neat, but not what we're looking for.
  • eval.c: this is defining "include" and "using" as methods. Also neat, also not quite it.
  • ruby.c: this takes some tracking down... But it's just requiring any library you pass with "-r" on the command line into main.
  • vm_eval: this is defining various flavors of "eval", which happen on the "main" object.
  • vm.c: there's a lot going on here - initialization and garbage collection, mostly. But in the end, it's not what we want.
  • proc.c: finally! This is what we're looking for.

Any Ruby source file can be great for learning more about Ruby. It's worth your time to search for "top_self" in any of these files to see what's going on. But I'll skip to the actual thing we're looking for - proc.c.


The Hunt... And the Capture!

In proc.c, if you look for top_self, here's the relevant bit:

void
Init_Proc(void)
{
  /* ... */
  rb_define_private_method(rb_singleton_class(rb_vm_top_self()),
                          "define_method", top_define_method, -1);

And that's what we were looking for. It's in an init method, it turns out - d'oh! But it's also redefining 'define_method' on main, which is exactly what we're looking for.

What does top_define_method do? Here it is, the whole thing:

static VALUE
top_define_method(int argc, VALUE *argv, VALUE obj)
{
    rb_thread_t *th = GET_THREAD();
    VALUE klass;

    klass = th->top_wrapper;
    if (klass) {
        rb_warning("main.define_method in the wrapped load is effective only in wrapper module");
    }
    else {
        klass = rb_cObject;
    }
    return rb_mod_define_method(argc, argv, klass);
}

Translated from C, and from Ruby internals this is saying several things.

If you're doing a load-in-an-anonymous-module, it tells you that you probably won't get what you want. Your top-level definition won't be properly global since you asked it not to be. And then it defines the method on Object, as an instance method, not just on main. And that is the feature we were looking for, defined in Ruby.

Winding Up

We've succeeded! We tracked down a simple but well-hidden feature in the CRuby source. It's cocoa and schnapps all around!

Benoit Daloze of TruffleRuby points out that this is all much easier to read if you define your Ruby internals in Ruby, like they do. He's not wrong.

But in case you're still using CRuby for things like Rails... It may be worth your time to learn to look around in the internals! And I find that nothing makes it work better than practice.

Also, this tells us exactly what's up with last week's post about Rake! Now we know how that works, which may be important when we wish to fix that...

Does ActionCable Smell Like Rails?

Not long ago, Rails got ActionCable. ActionCable is an interface to WebSockets and (potentially) other methods of turning a normal sent-to-browser web page into a two-way connection that can keep exchanging data. There have been a lot of these attempts over the years - WebSockets, Server-Sent Events, Comet and Server Push (HTTP1 and HTTP2) are all protocols to do that. There have been many Ruby implementations of these. Good old AJAX was probably the first widespread attempt. I'm sure there are some I missed. It's been the "near future" for as long as there's been a present.

Do you already know why we want WebSockets, and how bad most solutions are? Scroll down to "ActionCable and Convenience" below. Or heck, scroll wherever you like - I'm not the boss of you.

Yeah, But Why?

One big question is always: do we need this? What good does it do us?

Let's look at one-way updates (server-to-browser) separately from two-way.

The "hello, world" of one-way interactive web pages is the page update. When Twitter or Facebook shows you how many updates are waiting, or pops up new posts, those are interactive web pages. In order to tell you what's waiting for you, or to deliver it, they have to interact with a page that's already in your browser. You can also show site news banners that change, or pop up an alert like "site going down for maintenance at midnight!" The timing is often not that important, so a little delay is usually fine. AJAX is the usual way to do this, or Server-Sent Events can be a bit more efficient at the cost of some complexity.

See that "99+" up there? For you to know how many notifications are waiting, Twitter has to tell your browser somehow.

See that "99+" up there? For you to know how many notifications are waiting, Twitter has to tell your browser somehow.

The "hello, world" of two-way interactive web pages is the chatbox. From a simple "everybody sees everything" single-room chat to something more complex with sub-areas and filtering and private messages, you have to have two-way interaction to make chat work. If you put intercom.io or similar customer service chatbots on your site, they have to use two-way interaction of some kind. Any kind of document collaboration (e.g. Google Docs) or multiplayer game needs it. Two-way interaction starts to make sense quickly if you're doing something that people update together - auction sites, for instance, or fast-updating financial markets (stock trading, futures markets, in-game auction houses.) You can do two-way interaction with AJAX but it starts to get inefficient quickly, and the latency can be high. Long-polling (e.g. Comet, SSE) can help, or you can work around the browser with plugins (e.g. Flash or Unity.) This is the situation WebSockets (and thus ActionCable) were really designed for.

There are one-way updates in the browser-to-server direction, but forms and AJAX handle those just fine. They are often things like form submit, error reporting or analytics where the user takes action, but there's only a simple acknowledgement -- "yup, you did that, the server saw it and you can get back to what you were doing."

So What's Different With Interactivity?

In old-style HTTP, the browser gets an HTTP page. It may already be cached, so the browser may not use the network at all! Some pages can work entirely offline. The browser can keep requesting pages or resources from the server when and if it wants to. That may fail - the network connection isn't guaranteed. But the server can't interfere with most of this. The server can't send anything it wasn't asked for. The server may not even know that this is all going on. If the HTML page came from cache, the server probably has no idea that any of this is happening. In a normal web framework, the request gets served and the server moves on to other requests without a backward glance.

If you want interactivity with a constant connection to the server, that changes everything. The server needs to sit and spin, holding the connection open. It needs to see what other connections are doing and figure out what to send to everybody else every time you do something. If Bob sends a chat message, it may go out to 250 other people who have a certain page open.

The Programming Model

One big difficulty with two-way interaction is that web servers and frameworks aren't usually designed to handle it. If you keep a connection open all the time and you can send to it at random times... How does that look to the programmer? How does it work? That's new for Rails... And Sinatra. And nearly any Ruby framework that isn't using EventMachine. So... nearly all of them.

It's not just WebSockets that have this problem, incidentally. HTTP/2 adds server push, which also screws up all the frameworks... But not quite as much as WebSockets does.

In fact, very few application servers (e.g. Puma, Passenger, Unicorn, Thin, WEBrick) are designed for pushing from the server either. You can hack long-polling or server push on top of NGinX or Apache, but... that's not how nearly anybody uses them. You really want an evented server. There are some experimental Ruby evented webservers. But mostly, that's not how you write Ruby web applications. Or nearly any other web applications, in any language. It's an inefficient match for HTTP1 apps, but it's the only reasonable match for HTTP/2 apps with much two-way interactivity.

Node.js folks can laugh at the rest of us here. They do evented web applications all the time. And even they have a bit of a rough road to HTTP/2 and WebSocket support, because their other tools (reverse proxies, caches, etc) are designed in the traditional way, not the HTTP/2 way.

The whole reason for HTTP's weird, hacked-on model of sessions and cookies is that it can't keep a connection to the server or repeatedly identify individual clients. What would we do if it could? Maybe we'll find out.

But the fact remains that it's weird and hard to combine a long-running stateful server with lots of connections (WebSockets) to a respond-and-forget stateless web server (NGinX, Apache, Puma, Passenger, etc.) in the current day and age. They're not designed to work that way.

I only know of one web server that was ever designed with this in mind: Zed Shaw's Mongrel2. It's a powerful, interesting model for a server architecture. It's also rough around the edges, very raw and not used in production by anybody I know of. I've tried to get it running with Ruby web apps, and mostly you rapidly discover that nobody else designs anything that way, so it's hard to use with anything you don't write from scratch. There are bespoke frameworks inside big tech companies (e.g. LinkedIn, Facebook) that do the same thing. That makes sense. They'd have to, even with their current architecture. The rest of us have a long road to get there.

ActionCable and Convenience

So: Rails bundled WebSocket support into recent versions. Problem solved, right? Rails is awesome about making things convenient, so we're golden?

Yes... and no.

I've worked with the old solutions to this like Faye and Juggernaut. There is absolutely no question that ActionCable is a smoother experience. It starts the extra server automatically. It includes all the extra pieces of software. Secure sockets work approximately out-of-the-box, maybe, with a bunch of ugly caveats that aren't the server's fault. But they're ordinary HTTPS caveats, not really new ones for WebSockets. Code reloading works, kind of. When you hit "reload" in your browser the classes reload at least, like, 80% of the time. I mean, unless you have connections from multiple browsers or something else unreasonable.

Let's be clear: for hooking WebSockets up to a traditional web framework this is a disturbingly smooth experience. That's how bad the old ways of doing this are. Many old problems like "have I restarted both servers?" are nearly 100% solved in development, and are only painful in production. This is a huge step up.

The fact that code reloading works at all, ever, is surreal. You can nearly always get it to work by restarting the server and then hitting reload in the browser. Even that wasn't really reliable with older frameworks (ew, browser caching.) Thank you, Rails asset pipeline! And there's only one server in development mode, so you don't have to bring down multiple server-side processes and reload your browser.

This stuff used to be incredibly bad. ActionCable brings the pain level down to something a smartphone-app programmer would call tolerable.

(I'm an old phone operating system programmer. We had to flash ROMs every time. You kids don't know how good you have it. Get off my lawn!)

But... Does It Smell Like Rails?

Programming in Rails is a distinctive experience. From the controller actions to the views to the config files, you can just glance at a chunk of Rails code to figure out: yup, this is Ruby on Rails.

For an example of "it's not the web, but it smells like Rails," just look at ActionMailer. It may be about sending email, but it uses the same controller actions and the views feel like Rails. Or look at the now-defunct ActiveResource, which brings an ActiveRecord-style API to remote procedure calls. Yeah, okay, it was kind of a bad idea, but it really looks like Rails.

I've been trying to figure out for awhile: is there a way to make ActionCable look more like Rails? I'll show you what I've found so far and I'll let you decide.

ActionCable kind of wants to be structured like Rails controllers. I'll use examples from the ActionCable Rails Guide, just to make sure I'm not misrepresenting it.

Every user, when they connect to your site, gets a single ApplicationCable::Connection object:

# app/channels/application_cable/connection.rb
module ApplicationCable
  class Connection < ActionCable::Connection::Base
    identified_by :current_user
 
    def connect
      self.current_user = find_verified_user
    end
 
    private
      def find_verified_user
        if verified_user = User.find_by(id: cookies.encrypted[:user_id])
          verified_user
        else
          reject_unauthorized_connection
        end
      end
  end
end

You can think of it as being a bit like ApplicationController. Of course, all your Channels inherit from ApplicationCable::Channel, which is also a bit like ActionController. In the Guide there's not much in it. In fact, it can be very problematic to have many methods in it. I'll talk about why a bit later.

Then you have actual Channels inherited from ApplicationCable::Channel, which correspond roughly to pub/sub subscriptions, and then you can subscribe to one or more streams on each channel, which are sort of subchannels. This is explained poorly, but it's not too complicated once you figure it out. ActionCable wants one more level of channel-ness than most pub/sub libraries do, but it still boils down to "listen on channel names, get messages for those channels." ActionCable's streams are what every other Pub/Sub library would call a channel, approximately, and ActionCable's Channels are a namespace of streams.

It's clearly trying to look like a Rails controller:

# app/channels/chat_channel.rb
class ChatChannel < ApplicationCable::Channel
  def subscribed
    stream_from "chat_#{params[:room]}"
  end
 
  def receive(data)
    ActionCable.server.broadcast("chat_#{params[:room]}", data)
  end
end

But then that starts breaking down...

Where ActionCable Smells Funny

ActionCable actions are a bit like Rails controllers, and they use a somewhat different API than every other Pub/Sub library to get it. That's not necessarily a problem. In fact, that's fairly Rails-like, as far as it goes.

An ActionCable action can only be called from a browser, though. So there's two fairly distinct forms of sending: browsers send actions, while the server sends "broadcasts", which can also be sent from the server, including from actions. That's a bit like Rails controller actions, though it's a bit unintuitive. And then the server sends back JSON data, like a JSON API.

Then, JavaScript receives the JSON data and renders it. Here's what that looks like on the client side:

# app/assets/javascripts/cable/subscriptions/chat.coffee
# Assumes you've already requested the right to send web notifications
App.cable.subscriptions.create { channel: "ChatChannel", room: "Best Room" },
  received: (data) ->
    @appendLine(data)
 
  appendLine: (data) ->
    html = @createLine(data)
    $("[data-chat-room='Best Room']").append(html)
 
  createLine: (data) ->
    """
    <article class="chat-line">
      <span class="speaker">#{data["sent_by"]}</span>
      <span class="body">#{data["body"]}</span>
    </article>
    """

This should look like exactly what Rails encourages you NOT to do. It's ignoring everything Rails knows about HTML in favor of a client-side framework, presumably separate from whatever rendering you do on the server side. You can't easily use Rails view rendering to produce HTML, and no Rails controller is instantiated, so you can't use things like render_to_string. There's probably some way to patch it in, but that doesn't seem to be an expected choice. It's certainly not done by default, and at a minimum requires including Rails' internal modules into your Channels.

Also: please don't include random modules into your Channels, because every public method on every Channel object becomes publicly callable via JavaScript, so that's a really unsafe thing to do. So I would absolutely not recommend you include the Rails modules for view rendering into your Channels, because I would not recommend including anything you don't control into your channels. You need near-absolute control of your set of public methods for security reasons. Exposing public calls to whatever Rails has exposed from internal modules as a public API isn't a good idea even if you love Rails views (and I do.)

I'm not saying it's hard to do it in a more Rails-like way. You can build a simple template renderer using Erubis for this if you want. I'm saying ActionCable won't do this for you, or particularly encourage you to do it that way. The documentation and examples all seem to think that ActionCable should ship JSON around and your JavaScript/CoffeeScript client code should do the rendering. To be fair, that's likely to be more space-efficient than shipping around HTML, especially because WebSocket compression is fairly primitive (e.g. permessage-deflate). But compromising the programmer API for the sake of bandwidth fails the "smells like Rails" sniff test, in my opinion. Especially because it's entirely possible to have the examples mostly use the server-rendering-capable flavor and mention that you can convert to JSON and client rendering rather than vice-versa.

Here's what a very simple version of that Erubis template rendering might look like. It's not difficult. It's just not there by default:

def replace_html_with_template(elt_selector, template_name, locals: {})
  unless template_name["."]
    template_name += ".html.erb"
  end
  filename = File.join("app/views", template_name)
  tmpl = Erubis::Eruby.new(File.read filename)
  replace_html(elt_selector, tmpl.evaluate(locals))
end

(The replace_html method above needs to be a broadcast to the client, in a format the client recognizes. Also, don't make this a public method on the Channel object - I actually wrap the Channel object with a second object to avoid that problem.)

In general, ActionCable feels simple and "raw" compared to most Rails APIs. Want HTML escaping? Ask for it explicitly. Curious who is subscribed to what? Feel free to track that yourself. Wonder what some of the APIs do (e.g. identified_by)? Read the source code.

That may be because it's an immature API. ActionCable is fairly recent, as Rails APIs go. Or it may be the ActionCable isn't going to be as polished. WebSockets are a thing you add to an existing app for better performance, as a rule. So maybe they're being treated as an advanced feature, and the polish isn't wanted. It's hard to tell.

A Few More Details on How It Works

Before wrapping up, let's talk a bit more about how ActionCable does what it does.

If you're going to have a bunch of connections held open, you're going to need network sockets for it and some way to do work for those connections. ActionCable handles this with a thread pool, with four workers by default. If you're messing with the database in your ActionCable code, that means you should increase your database connection pool by that number of workers to avoid running out.

ActionCable eats a ton of memory to do its thing. That's fine - it's the best Ruby environment for WebSocket development, and you didn't start using Rails because it was the fastest or smallest - if you wanted that, you'd be writing bespoke C binaries for CGI scripts, or maybe assembly language.

But when you're looking at deploying to a production environment with a reasonable number of users, you may want to look for a more efficient, API-compatible solution like AnyCable. You can find a RubyKaigi talk by Vlad Dementyev about that and how it compares, if you'd like more information.

While ActionCable uses only a single server in development mode, it's assumed you'll want multiple in production. 

So What's the Takeaway?

ActionCable is a great way to reduce the pain of WebSockets development compared to the older solutions out there. It provides a relatively clean development environment. The API is unusual - not quite Rails, not quite standard Pub/Sub. But it's decently clean and usable once you get used to it.

A Rails API is often carefully polished. They tend to be hard to misuse with strong indicators of how to do things The Rails Way and excellent documentation. ActionCable isn't there yet, if that's where they're headed. You'll need more sophistication about what ActionCable builds on to avoid security problems - more like old-style Rails routing or controllers, less like heavily-secured Rails APIs like forms, HTML escaping or forgery protection.