Diving into Japanese for Ruby

I only started studying Japanese recently... But these days, I'm working on the Ruby language, and Japanese turns out to be a big help there. You can find several gaijin learning Japanese to work on Ruby, it turns out.

If you need to pick up Japanese in a massive hurry and you want advice from somebody a few months farther along than you are, keep reading.

First, Get Google Translate

The simplest way to handle Japanese is to let the machine do it. There's a great Chrome extension for Google Translate, and before that you can use it manually (ew.) Some of Translate's output won't make any damn sense. That is normal and expected. But it's still mostly better than nothing.

To get an idea of how useful (and not-useful) it is, I recommend translating this wonderful article on profiling by Yui Naruse. The article isn't available in English, it kinda-sorta works with Google Translate, and you can just about limp through it without knowing any actual Japanese.

So: Google Translate is an okay step one, and really easy. Do that first.


Second, Immerse Yourself

You'll want to be surrounded by Japanese to pick it up. Better, surround yourself with Japanese Ruby stuff.

Google for Ruby stuff and click Japanese links. Read bugs. I'm told there's good Japanese Ruby IRC but I can't seem to find it.

For more, follow Twitter accounts. I've had good luck following Matz, Koichi Sasada and Nalsh. You might also like Yusuke Endoh, Shibata Hiroshi or Akira Matsuda. There are others, and they tend to retweet each other, so feel free to pick up new Japanese developers as you go along.

Twitter offers a second Bing-based translation for each Tweet. Sometimes it's better than Google Translate, sometimes worse, sometimes both will make zero sense. That's how it goes. You can also use Jisho and Rikaikun to translate specific words.

You will, however, start picking up little figures of speech like Koichi's "うーん" (sort of an "uh..." or "ugh..." suggesting that he's tired.) Which is what you're there for - to see Japanese words used by Japanese developers doing Ruby things.

Plus you can start picking apart Hiragana from Katakana and learning common borrowed-from-English words that are used in Japanese. Speaking of which...

Third, Learn the Alphabet(s)

However you start formally learning Japanese, they're likely to start teaching you Hiragana and Katakana, the two easier Japanese alphabets... Or syllabaries. Or whatever you want to call them. Kanji's the really hard one, and you won't learn it immediately. But Google Translate plus Hiragana and Katakana will take you farther than you'd think.

But they'll also teach you to start picking apart sentences into Hiragana, Katakana and Kanji, which lets you start teasing out and learning interesting words, such as "ツール" (tool).

This takes time, repetition and memorization. Which is why you're self-immersing on Twitter and stuff, right?

Also, practice with an app. I like Kana Mind, but there are many.

Fourth, Keep Learning

At some point these stop being "learn Japanese in a massive hurry" tips. Instead, they're just "learn Japanese" tips.

Get a teacher? Yes, it helps a lot.

Books? Sure. I like Japanese the Manga Way and your teacher probably wants you to buy Minna No Nihongo and its English translation (please do.) But do what works for you.

Study buddies? If you can, definitely. Good study partners can be hard to find. But they're really useful!

In general, yes, keep going.

Finally...

Thanks to Al Tobey, who helped me with a lot of my initial jump into Japanese. Several of these recommendations were from him first.

And thanks to the ever-friendly Ruby folks, Japanese-speaking and English-speaking alike.

Since you kept reading this far (thanks!), here's a list of Japanese terms from the Ruby bug tracker. I got them from a Ruby developer on Twitter.

まってる -> feedback
まだ -> open
まつ -> matz
なおした -> closed
なおってた -> closed
なおさない -> rejected


Tales from an Internship: Solving a Race Condition in Twilio Usage

by Ky-Cuong Huynh.

Overview

Interns at AppFolio are entrusted to contribute to real production work. After
2 weeks of training on AppFolio's processes and tools, I had the awesome
privilege of shipping code to production alongside my team every week since.
Along the way, I learned so much under the mentorship of fantastic engineers.
This led to the (technical) highlight of my summer: solving a race condition in
our Twilio usage and saving the company a significant amount of money every
year.

To understand how that race condition arose, here's a quick summary of our
multi-app architecture [0]: our production boxes run Passenger, a fast and
powerful app server. It achieves its speed by coordinating a pool of worker
processes to handle incoming requests. Then, for simplicity, we can think of
each of AppFolio's customers as having their own box that serves up the
AppFolio Property Manager (APM) they know and love.

When APM needs to communicate with Twilio's API, we have an internal app called
Messenger (also running on that same box). It accepts message-send requests
from other apps and acts as a middleman for Twilio, encapsulating all the logic
required. Multiple instances of Messenger may be running on a given box, one
per Passenger worker. As message-send requests arrive from APM, they may be
assigned to different workers. Now comes the race condition. If a customer has
sent too many messages in a 24-hour period, then Twilio recommends purchasing
another number to use. This prevents the first number from being marked as a
spam-sending one by carriers.

Unfortunately, more than one Passenger worker may believe it is necessary to buy
another phone number from Twilio, even if only one more number overall was
required. Thus, a customer may end up with more numbers than needed. That
introduces an unnecessary recurring expense for AppFolio, one that increases as
we have more customers.

Now, this was a known race condition. The team that built Messenger added a
lock around the provisioning code (our critical section/region). Alas,
Messenger instances can enter/exit the region one after the other. Even if only
one worker process executes the code at any point in time, we still end up with
multiple executions of the provisioning code.

Our solution: check if provisioning is actually necessary while inside of the
critical region. In other words, we added a check that asks, "Do I actually
need another phone number, or has enough sending capacity already been added?".
In the end, we spent far more time reasoning carefully than we did coding,
which is a common occurrence for complex real world problems.

Background

The bulk of my summer was spent working with my team on bulk texting
functionality. Our work empowered property managers to easily text whole units
or properties at once. Along the way, carrier limitations meant that we had
extended our messaging architecture to potentially map many phone numbers to
each customer. Towards the end, I learned of the interesting race condition
in question and began analyzing it. But first, some context.

Twilio's Quotas

At AppFolio, we use Twilio to send text messages.
Twilio recommends a rolling quota of 250/messages per 24-hour period. "Rolling" means that old messages no longer count against the quota once 24 hours have elapsed from the time they were sent. We can think of this a conveyor belt of messages, each of which returns to us for use after 24 hours. Note also that this is a soft limit, meaning that Twilio doesn't enforce this strictly. Rather, if we send more than 250 messages/24 hour period for a single phone number, that number risks being marked as a spam number by carriers. If a number is marked as a spam number, then its messages may be silently filtered out from ever reaching their recipients.

There's one more wrinkle. When a conversation is seen as "conversational" by carriers, there is a higher threshold for blacklisting numbers as spam senders. These also vary by carrier, but Twilio recommends 1,000 messgages per (rolling) 24-hour period when a communication is more 2-way. To be safe, our internal limits model this conversational threshold as a +1 to the quota for every message received.

Sending Messages Using Messenger

Messenger is essentially our internal middleman for Twilio. Every app that needs to send text messages can do so by sending a request to Messenger, which will handle the back-and-forth with Twilio. Messenger itself presents a set of JSON APIs that are message-oriented. It's designed to take in requests for sending a single message. It has no concept of groups/batches of messages
(which is something we considered adding to speed up sending bulk texts).

Here's an overview diagram:

apm_bundle messaging architecture

The Race Condition

To make things more concrete, we'll walk through the code flow for sending a bulk text.

In Property, our TenantBulkSmsService is invoked to create a background job for sending requests to Messenger. Messenger receives the request from Property and sends the message using TwilioInterface::Sender.send_message:

class << self
  def send_message(body:, to_phone_number:, ignore_sending_limit: false)
    # Check customer quota and message length
    raise DailyLimitExceeded, # ... 
    raise BodyTooLong, # ...

    # RACE CONDITION entrance: we potentially provision as part of the
    # Twilio configuration
    config = verify_and_load_twilio_config

    # Send message with the proper parameters
    prepared_message = TwilioInterface::PreparedMessage.new(body: body, to_phone_number: to_phone_number)
    response = config.twilio_subaccount_client.send_message(
      # From:, To:, Body:, etc.
      # ...
    )

    # If here, successful message send
    TwilioInterface::Sender::SuccessfulResponse.new(twilio_response: response)
    # Else, Twilio error handling
    rescue Twilio::REST::ServerError
    # ...

That verify_and_load_twilio_config method leads to the retrieve method here:

module TwilioInterface
  class PhoneNumberManager
    class << self
      def retrieve
        # RACE CONDITION: more than one Messenger instance
        # may find this condition to be true and proceed to provisioning logic
        if need_provision?
          TwilioInterface::PhoneNumberProvisioner.provision!
        end
      end

      # Other class methods
      # ...

That need_provision check is later down this same file:

def need_provision?
  if Experiments.on?(:texting_quota)
    (TwilioInterface::DailyLimitChecker.current_amount_under_limit < 1) && !reach_max_capacity?
  else
    !provisioned?
  end
end

The race condition occurs here: more than one Passenger worker process (running Messenger) may
enter this method and find TwilioInterface::DailyLimitChecker.current_amount_under_limit to be < 1. Then, they would all proceed to TwilioInterface::PhoneNumberProvisioner.provision!:

def provision!(purchase_filter = {})
  create_new_number(purchase_filter)
end

So we go to create_new_number:

def create_new_number(purchase_filter = {})
  # RACE CONDITION consequence: multiple Passenger workers
  # may enter this critical region one at a time and each
  # purchase an (soon unnecessary) number
  lock = Lock.first
  lock.with_lock do
    unless PhoneNumberManager.reach_max_capacity?
      # Provision new phone number
      # ...
    end
  end

  rescue Twilio::REST::RequestError => e
    raise TwilioNumberNotPurchasable, e
end

This is where the phone number purchase actually occurs. Notice that the
purchasing logic is protected by a lock. This is a leftover from when a
previous team originally implemented this code and noticed the race condition.
They solved it for the single phone-number case, but now we had to generalize
to multiple phone numbers. At this point, my mentors and I understood the
race condition and were ready to solve it.

Aside: A Database-based Lock

You may have wondered why we're not using the Mutex class built into Ruby's standard library. In fact, if we dig into that Lock implementation, it's just using a single row in a table on the database. So why are we using the database to implement a lock?

Here's why: our issue is not coordinating multiple threads on a single machine (or guarding against interrupts with a single thread), but rather multiple processes that are potentially across multiple machines. This is because customers may have more than one physical box running Passenger (though this race condition can still occur in the multi-process, single-box case). Any mutex we create would only exist in the memory of one of those boxes.

What stops this from becoming a full-blown distributed systems problem is the fact that everything in a box shares a single database. We can leverage that shared database to coordinate/synchronize access to this piece of code. This is possible because MySQL uses its own locks as part of achieving its ACID properties. Then, the biggest users of those locks are transactions.

To make use of all this, the Lock#with_lock [2] method simply wraps the passed-in block code in a transaction. To test this unusual lock, we opened two Rails consoles and had one try to enter the critical region after another had already done so. We found that the lock did indeed prevent access, at least until it was released. Note, however, that ActiveRecord appears to have a default timeout for how long to wait to acquire a lock.

The Fix

The fix for this race condition is surprisingly simple. At its core, we face the issue that Messenger processes are checking against how many phone numbers a customer may have, rather than the capacity they may have already gained. So, we simply add this check to the critical section:

def create_new_number(purchase_filter = {})
  lock = Lock.first
  lock.with_lock do
    if TwilioInterface::PhoneNumberManager.need_provision?
      # Provision
      # ...

And recall that that check looked like this:

def need_provision?
  if Experiments.on?(:texting_quota)
    (TwilioInterface::DailyLimitChecker.current_amount_under_limit < 1) && !reach_max_capacity?
  else
    !provisioned?
  end
end

Now, a natural question is "Why wouldn't we simply add the database-based lock around the first need_provision? check?"

Answer: because that method is called for every single message to be sent, whereas actually provisioning more numbers only happens on occasion. Whenever locks are used, we're defining a critical region of code that can only be accessed by one process at a time. This makes a tradeoff of safety vs. speed. Putting a lock around the first need_provision? overly widens our critical region and reduces message throughput.

Verifying the Fix

To check the fix, we'll want to modify some of our method calls to simplify testing. To start, we'll stub the provisioning logic lock to let us know
what occurred:

def create_new_number(purchase_filter = {})
  lock = Lock.first
  lock.with_lock do
    if TwilioInterface::PhoneNumberManager.need_provision?
      PhoneNumber.create!(
          twilio_subaccount_id: 7,
          sid:                  "#{Random.rand(100)}",
          number:               "+#{Random.rand(100)}",
          friendly_name:        "+#{Random.rand(100)}"
      )
      puts "I provisioned a new number!"
    else
      puts "I did not provision a new number"
    end
  end

Next, we modified the database and calls so that the first number is exhausted. Note that test messages must be dated for today because of the 24-hour rolling quota!

And when we run:

TwilioInterface::PhoneNumberProvisioner::provision!

Then, the first console says, "I provisioned a new number!", but the second console to execute this gives, "I did not provision a new number". Race condition resolved! We were also able to devise a test case to guard against regressions. That test now runs as part of every continuous integration (CI)
build.

If anyone has any questions, I can be reached on Twitter or via email at kycuonghuynh@ucla.edu.

Appreciations

Thank you to Yunlei and Magne for collaborating with me on this.
You were both amazing mentors and truly made my summer. I've grown so
much under your careful guidance and I can't wait to keep learning and building.

Thank you to Flavio for regression testing this fix. AppFolio cares highly
about the level of quality delivered to its customers and you serve as a
strong advocate for them.

Thank you to Jingyu and Chris (authors of the original Messenger code) for encouraging me to pursue a fix and then helping me understand Messenger.

Finally, thank you to Andrew for letting me write about this, as well as editing this post and recruiting me to AppFolio.

Footnotes

[0] A review of the concurrency material from OSTEP, a free operating systems textbook, can also be helpful.

[1] Using a code texted to a device as part of login is really using 2SV,
second-step verification, since the code is still a piece of knowledge.
This belongs to the the same class of factors as passwords ("something you know"). A Yubikey or biometrics requirement would constitute a true second factor ("something you have" and "something you are", respectively).

[2] It is Ruby convention to refer to instance methods in documentation via ClassName#instance_method.

Internships at Appfolio

At Appfolio we take pride in having a high quality internship program.  This year, at the end of the summer, two interns chose to write up their thoughts on the summer that the spent with us.

Christopher Chen, from Berkeley, had the following to say about our software engineering internship:

When I first started at Appfolio, I had two prior technical internships, the first at a very large company, and the second at a small company. Neither of them were what I’d call inspiring and the first actually made me question majoring in computer science. Starting in October of my junior year, I applied to many of the large, well-known, Bay Area tech companies with mixed responses. Appfolio was an afterthought at the time since I’ve never heard of the company before. Weighing the offers of multiple companies, I eventually chose to go to Appfolio due to its strong employee satisfaction on Glassdoor.

Soon it was mid-May, the end of my second semester as a junior, and the beginning of my internship. I was unsure of what to expect - my friends were interning at large Bay Area tech companies, meanwhile what well-known tech companies are located in Santa Barbara? (surprisingly many, as it turns out) 

My concerns were put to rest on the first day; interns were given Macbook Pros to work with, in a modern office setting with desks that could go from standing to sitting height at the touch of a button. Snacks were a-plenty and it was overall a great work environment. 

I began with a 2-week training session in Ruby on Rails, building enough technical knowledge to begin working in a team - I would continue to learn as I developed new features. I also participated in team decision-making and it struck me how seriously I was being taken, even as a fresh intern. The team welcomed my ideas and almost immediately I was accepted into the team, not as an intern, but as an engineer. 

As I type this sitting at my desk on my final day after 3 months, I reflect on how different this internship was from my previous one. At one of my previous internships, my mentor was a man who was well-known in his field, regularly taught graduate classes, had many patents under his name, and was otherwise very respected. However, I was lucky to get an hour per week from him. Here at Appfolio, Natalie, my very bright and hardworking mentor, was always willing to spend time with me. Under her guidance, and that of the entire team’s, I built many customer-facing features, those that would later bring about highly positive customer feedback. Through being productive, I also learned more than I did at any other internship. Beyond technical skills (like learning an entirely new language and web development stack), I also learned and refined social skills like working effectively in a team setting and buying in on the company culture.

The main difference, and the best one, was how much trust I was given. I hit the ground running with a non-trivial project (unlike those of my previous internships) that was immediately utilized in the live release. I was able to directly speak to customers about features they want and needs they need fulfilled. What I was able to get done was fulfilling for the customers and for me - it was my first experience as a “real” engineer in a software company, not the intern whose time was worth little.


Sophia Zheng, also from Berkeley, had this to say about our product management internship:

Adjusting to a new workplace can be hard for anyone, but AppFolio has a way of seamlessly incorporating interns into the company. During my first couple weeks at AppFolio, I attended several sessions that taught me the skills I needed to be an effective employee. 

From there, I was put on two teams that were working on features that would go live to all customers, and I think this is what distinguishes an AppFolio internship from other internships. Instead of putting all the interns on an intern project that may or may not be used in the end, interns are given the same responsibilities as regular employees. As a product intern, I was given my own feature to product manage--I can’t say that’s common for many other product management internships. I got my own product management experience, from working with developers and user experience to contacting customers for research. During my internship, we pushed out two major stories for the feature I was in charge of to all customers. 

I was also given two other projects: I got my own personal research project and I was put on a market validation team. During market validation meetings, my thoughts were acknowledged and taken into consideration, and the results of my research were taken seriously. 

AppFolio truly does an amazing job at making sure interns do work that matters to the company. I will say this though: if you take an internship at AppFolio, also be prepared to play a lot of foosball. 

ABProf: An Accurate Statistical Profiling Harness

ABProf is a tool to compare which of two programs is faster. It can prove that a particular optimization worked, which is my job these days.

We talked about the easy-to-use version of ABProf recently. Let's talk about the more powerful and accurate version now. It's a bit harder to use, but often worth it.

To follow this post, first install abprof: "gem install abprof" will generally do it.

A Simple Example

Let's look at the simple version of the harness code. The below example sets up a block for sampling -- ABProf will run it repeatedly to check it for speed.

#!/usr/bin/env ruby

require "abprof"

puts "ABProf example: sleep 0.1 seconds"

ABProf::ABWorker.iteration do
sleep 0.001
end

ABProf::ABWorker.start

This is written in ABProf's worker DSL (Domain-Specific Language), which is different from its benchmark DSL.

This DSL is used to set up a worker process for ABProf. Normally ABProf will run two workers and use them to check which of two processes is faster, unless you run it "bare" and supply a block of Ruby. Bare, it will run the block from ABProf's own process. Running in a single process is fast but limits you to a single version of Ruby in-process (and a few other things.)

So: the benchmark DSL sets up a test between two workers (command lines, number of trials to run, desired accuracy, etc.), or you can just specify all that from the command line. The worker DSL sets up a single worker, or you can skip it and get worse accuracy when measuring.

Why worse accuracy? Because being able to do just one specific action is better than doing that plus having to start up a new process. The most accurate measurement is the one that does nearly nothing except measuring. Also, just running what you need instead of spinning up a new process is a bit faster. So without harness code, abprof takes longer to converge, and you wait longer for your benchmarking.

If you wanted to do an A/A test of sleep.rb against itself, you'd run abprof this way:

abprof examples/sleep.rb examples/sleep.rb

You can also pick how many trials to run, how many times to run the block per trial and many other options. Run "abprof --help" for the full list and default values. Here's an example:

abprof --pvalue=0.001 --min-trials=10 examples/sleep.rb examples/for_loop_10k.rb

By default, abprof runs your code block or your program a fair number of times -- 10 before it starts measuring, 10 per trial run. For something very slow (e.g. 5 minutes per run) you'll probably want fewer, while for something fast like a tight "for" loop you'll probably want many more. 10 times isn't many when you're benchmarking small, tight code.

The two commands, abprof and abcompare, are very similar. If you run abprof in "bare" mode with two command-line programs, you're getting the same thing as abcompare.

A More In-Depth Example

The example above is pretty simple - the block runs a single iteration. We can get better accuracy by running several at once, or by having the code measure in a specific way. ABProf supports both of these modes by changing the method used to supply the block. In the above, that method is called "iteration" and it times very simply. If you call the method "iteration_with_return_value" and return a measurement, you can time it yourself.

Here's an example:

#!/usr/bin/env ruby

require "abprof"

puts "ABProf example: sleep 0.1 seconds"

ABProf::ABWorker.iteration_with_return_value do
t1 = Time.now# Can also be a counter
  sleep 0.01
  (Time.now - t1)# Return measurement
end

ABProf::ABWorker.start

This can be useful if you need to do setup or teardown for every iteration, or if you want to measure a counter rather than time, or if you have some kind of custom timer that you want to do yourself rather than using Ruby's built-in Time.now() for timing, as ABProf does.

Be careful - ABProf will tell you it's returning the lower command. When the measurements are time, lower means faster. But if you return a counter or other higher-is-faster performance measurement, ABProf will consistently return the lower result, which may not be what you expect. That's why ABProf keeps printing "faster?" with a question mark to the terminal. If you return something other than a time, lower may not mean faster.

Randomly: don't use an explicit "return" in the block. It's a block, not a lambda, so "return" won't do what you want. Just add the return value as the final one, as in the example above.

Conclusion

So: want better accuracy than with abcompare? Want to take out process startup time as a factor? Use abprof.

Want to do your own timing, or otherwise control it more? Use the "iteration_with_return_value" method instead of just "iteration", and return a value. Also, use abprof.

Want to just quickly, roughly see if something is a lot faster? You can keep using abcompare. But it'll take longer to be sure, so if you're going to keep doing it, use abprof.


ABProf: Profiling Ruby Like an A/B Tester

Lately I've been trying stuff out with Ruby configurations, and inlining functions when compiling Ruby and trying to tell if they made anything faster. That's harder than it sounds -- the standard benchmarks for Ruby are kind of noisy. They give slightly different answers from run to run. It's a pretty common problem in benchmarking and profiling. How can I tell if I'm actually making things consistently faster or just fooling myself?

If I take a lot of samples, then maybe the dark power of statistics could tell us if one way was consistently faster?

Turns out: YES! In fact, I'm not even the first person to do this with optcarrot, though they use the tests for something slightly different.

I built a simple tool, called ABProf, to do it. Let's talk about that.

The Basics

We want to run optcarrot with two different Rubies and see which is faster, with what likelihood, and by how much. But we don't need a Ruby-specific tool to that -- the tool can just run two benchmarks without knowing what they are and do a statistical test. So that's what ABProf does.

Specifically, it installs a command called "abcompare" to do that.

The abcompare command is simple. Give it two command lines:

abcompare "sleep 0.01" "sleep 0.0095"

And it'll spend some time to tell you that, yes, one is faster than the other. It'll even tell you how much faster one is than the other, roughly. The output will look something like this:

Trial 3, Welch's T-test p value: 0.0032549239331043367
Based on measured P value 0.0032549239331043367, we believe there is a speed difference.
As of end of run, p value is 0.0032549239331043367. Now run more times to check, or with lower p.
Lower (faster?) process is 2, command line: "sleep 0.0095"
Lower command is (very) roughly 1.0445033124951848 times lower (faster?) -- assuming linear sampling.
Process 1 mean result: 1.3370193333333333
Process 1 median result: 1.342169
Process 2 mean result: 1.2836166666666664
Process 2 median result: 1.284983

Yup. And with one command being around 5% faster, even a very quick, rough test like this says it's around 4.4% faster. Not too shabby. Decrease the P value or increase the trials or iterations per trial for more exact results.

exe/abcompare --pvalue 0.001 --iters-per-trial=10 --min-trials=10 "sleep 0.01" "sleep 0.0095"

You'll get less exactness if you pick two things that are very close, where starting the process takes most of the time.

abcompare "echo bob" "echo bologna sandwich with mayonnaise"

The above lines compare equal, because echo is so fast (compared to the time to start the process) you just can't see the difference. There's a more exact version of abcompare in development to help with this.

The Ruby-Tinted Truth

Want to check if one Ruby or another is faster when running optcarrot, a subject near and dear to my heart? You'll need to cd into the appropriate directory and use "runruby" to make sure you get the right environment. Also, you'll probably want to see the abcompare output as it goes, so your command shouldn't print to console. And you need to make the total number of times to run it be sane -- if every test takes a few seconds, running many hundreds of them takes quite a long time.

Also, a way to make optcarrot profile better - its benchmark mode is the same as "--headless --print-fps --print-video-checksum --frames 180", so you can use that, but increase the number of frames and not pay the process startup overhead so many times. Nifty!

With all that taken care of, here's how to do it with two built Rubies in "vanilla_ruby" and "inline_ruby_2500".

abcompare "cd ../vanilla_ruby && ./tool/runruby.rb ../optcarrot/bin/optcarrot --headless --print-fps --print-video-checksum --frames 1800 ../optcarrot/examples/Lan_Master.nes >> /dev/null" "cd ../inline_ruby_2500 && ./tool/runruby.rb ../optcarrot/bin/optcarrot --headless --print-fps --print-video-checksum --frames 1800 ../optcarrot/examples/Lan_Master.nes >> /dev/null" --iters-per-trial=1 --min-trials=10 --pvalue=0.001 --burnin=2

This is also a great example of using abcompare with a nontrivial program. Consider putting this long command into a shellscript to run repeatedly :-)

You can get better measurement with the more advanced ABProf version in development, the one that's a bit harder to use... This one is counting startup time as part of the total, so you'll see 5% improvement instead of the 7% improvement mentioned in a previous post... Don't worry, there will be another post on the more exact version of ABProf!

More Better Awesomer Later

ABProf can use a harness of Ruby code, kind of like how Ruby-Prof does it. That's to let it run without having to start a new process on every iteration. Process startup time is slow... and worse, it varies a lot, which can make it hard to tell whether it's your benchmark or your OS that's slow. When you can, it's better to just run your benchmark in a single, longer-lived process.

At the very least you should have the choice to do it that way. The same command can also handle a fun DSL to configure your various tests in more complicated ways...

But for right now, abcompare will do what you want, and do it pretty well. It just takes a few extra iterations to make it happen.

Look for another blog post on how to do this very soon.

What's My Takeaway?

Want to prove you made something faster? Use abcompare. To prove you have the amount of speed-up right, increase the number of iterations per trial, or increase the number of minimum trials, or decrease the P value.

Want to check which of two Rubies is faster? Build both and use abcompare.

Need to prove that something already pretty darn fast is now faster? Do the operation many times per trial or wait for the newer, spiffier ABProf to bring you a way to prove it.


Speed Up Ruby By 7-10% Or More

These days, my job is to speed up Ruby (thanks, AppFolio!) One way to do that is by careful configuration options for building the Ruby source. Let's talk about a nice recent discovery which may help you out. It works if you use CLang -- as Mac OS does by default, and Linux easily can. CLang is intended to be the next GCC by replacing it with a fully-compatible LLVM-based successor. CLang is most of the way there, and ships by default on the Mac. It's available pretty much everywhere. In addition to MacOS, we'll also talk about this speedup on CentOS, a popular OS to deploy Ruby over top of.

Function Inlining

By default, GCC will inline functions on the higher optimization levels. That is, for short, simple functions, it will just substitute the whole function body where you called the function. That lets you skip a function call at runtime. But more important, it lets the compiler skip parts of the function that aren't used, special-case for the parameters that get passed in and otherwise speed up the code.

The down-side is that the code gets bigger - if you put in the full function definition at each call site, things get big. So there's a balancing act for how big a function you inline -- if you inline huge functions it doesn't buy you much speed and the code gets huge. If you never inline anything, the code is as small as it can be, but also slow.

CLang has an easy way to tune what size function you inline. It has an internal metric of how big/complex a function is, and a threshold (default 225) for where it inlines. But you can turn that threshold way up and inline much bigger functions if you want to.

The result is a bit hard to measure. I'll write another blog post on the stats-based profiler I wrote to convince myself that it does speed things up noticeably. But I'm now convinced - with higher inlining settings, you can make a Ruby that's faster than vanilla Ruby, which uses -O3 and the default inlining threshold of 225.

How Big? How Fast? (Mac Edition)

I'm using a standard Ruby benchmark called optcarrot to measure speed here as I tend to do. I'm adding inlining options to Ruby's defaults for optimization ("export optflags='-O3 -fno-fast-math -mllvm -inline-threshold=5000'"). Each of the measurements below used hundreds of trials, alternating between the two implementations, because benchmarks can be noisy :-/

Still, how much faster?

  1. cflags="-mllvm -inline-threshold=1000": about 5% faster?
  2. cflags="-mllvm -inline-threshold=1800": 5% faster
  3. cflags="-mllvm -inline-threshold=2500": 6% faster
  4. cflags="-mllvm -inline-threshold=5000": 7% faster

Those Rubies are also bigger, though. Plain Ruby on my Mac is about 3MB. With an inline threshold of 1000, it's about 4.8MB. At a threshold of 2500, it's about 5.5MB. With a threshold of 5000, it's about 6MB. This doesn't change the size of most Ruby processes, but it does (once per machine) take that extra chunk of RAM -- a 6MB Ruby binary will consume 3MB of additional RAM, over what a 3MB Ruby binary would have taken.

Note: these may look linear-ish. Really they're just very unpredictable, because it depends which functions get inlined, how often they're called, how well they optimize... Please take the "X% faster" above as being noisy and hard to verify, even with many trials. The 1000-threshold and 1800-threshold are especially hard to tell apart, says my statistical profiling tool. Even 1000 and 2500 aren't easy. Also: measured vs recent MacOS with a recent Ruby 2.4.0 prerelease version.

How Big? Host Fast? (CentOS 6.6 Edition)

I didn't do the full breakdown for CentOS, but... It's actually more of a difference. If I measure the difference between -inline-threshold=5000 and default CLang (with -O3 and -fno-fast-math, the defaults, which uses 225 as the inline threshold), I measure about 14% faster.

But that's cheating - the version of CLang available here (3.4.2) is slower than the default GCC on CentOS 6.6. So how about measuring it versus GCC?

Still about 9% faster than GCC.

The CentOS binaries are a bit bigger than MacOS, closer to 8MB than 3MB with debugging info. So the doubling in size makes it bigger, about 18MB instead of 6MB. Beware if you're tight on RAM. But the speedup appears to be true for CentOS, too.

(Measured on recently-updated CentOS 6.6, a Ruby 2.4.0 prerelease, CLang 3.4.2 vs GCC 4.47. YMMV, for all sorts of reasons.)

Disclaimers

So: can you just make Ruby 10% faster? Only if you're CPU-bound. Which you probably aren't.

I'm measuring versus optcarrot, which is intentionally all about CPU calculations in Ruby. "Normal" Ruby apps, like Rails apps, tend to waiting on the OS, or the database, or the network, or...

Nothing you can do to Ruby will speed up the OS, the database or the network by much.

But if you're waiting on Ruby, this can help.

Did Somebody Do It For Me?

Wondering if this got picked up in mainline Ruby, or otherwise made moot? You can check the flags that your current Ruby was compiled with easily:

ruby -r rbconfig -e "puts RbConfig::CONFIG['CFLAGS']"

You're looking for flags like "-O3" (optimization) and "-mllvm -inline-threshold=5000" (to tune inlining.) You can do the same thing with ./tool/runruby inside a built Ruby directory. If you see the inline-threshold flag, somebody has already compiled this into your Ruby.

Conclusion

This option is a great deal if you're on a desktop Mac -- 3MB of RAM for a 7% faster Ruby -- but questionable on a tiny Linux virtual host -- 8MB for 10% faster, but you're probably not CPU-bound.

It is, however, only available with CLang, not with vanilla GCC.

I've opened a bug with a patch to make this behavior default with CLang. Let's see if the Ruby team goes for it! And even if they don't, perhaps ruby-build or RVM will take up the torch. On a modern Mac, this seems like a really useful thing to add.

How do you add it? You need to reconfigure Ruby when building it

Using GPerfTools on MRI Ruby in Mac OS X

There are a lot of great profilers for code that runs in Ruby. There are... fewer really good profilers to work on a standard generated-by-GCC binary, like the Ruby interpreter itself. GPerfTools and Instruments are really your choices, with an honorable mention for DTrace - it isn't a profiler, but it's so flexible that it can do a lot of profiler-like things, including for Ruby.

Today, let's talk about getting GPerfTools working with Ruby - specifically, with "vanilla" Ruby, often called Matz's Ruby Interpreter, or "MRI."

First, download the Ruby source. These days, that can be as simple as git-cloning its GitHub repository. Then you can "autoconf && ./configure && make", which can be enough to get you up and working -- if you don't have OpenSSL problems, anyway.

You'll need GPerfTools, of course. Assuming you use Homebrew, you can install a few useful dependencies like this:

brew install gperftools
brew install graphviz # you'll see why later

You'll also need to build Ruby with the GPerfTools profiling library, and with Address Space Layout Randomization turned off (Mac OS calls its ASLR implementation Position Independent Executables, or PIE.) And it wouldn't be bad to tell it to always use a frame pointer -- marginally slower, but easier to debug at times. That probably looks like this:

export LIBS="-lprofiler"
export cflags="-fno-omit-frame-pointer"
export LDFLAGS="-Wl,-no_pie"
./configure && make clean && make && make check
unset LIBS
unset cflags
unset LDFLAGS

You can also pass -pg in cflags, but that's likely to slow things down a fair bit. (Why those lines? See our post on configuring the Ruby source code for details.)

You might need other things, such as "export PKG_CONFIG_PATH=/usr/local/opt/openssl/lib/pkgconfig:/usr/local/lib/pkgconfig" to configure OpenSSL -- add what you need for your setup as well, naturally.

And now your Ruby should be compatible with GPerfTools. Great! That was a nice short blog post, and now it's cocoa and schnapps all around!

But What Do We Use It For?

We'd like to check against a nontrivial benchmark - the core team often uses a toy Nintendo emulator called optcarrot right now for benchmarking. So let's set that up.

cd .. # Back up one directory from your Ruby source
git clone git@github.com:mame/optcarrot.git
cd optcarrot
ruby bin/optcarrot --benchmark examples/Lan_Master.nes

I see output like this when I run it:

fps: 34.313312258259884
checksum: 59662

So: now we have a thing to profile. How do we profile it?

What Next?

How do we use it? And what if something went wrong?

First, let's try to generate some profiling data. Profilers are quite picky about knowing what program generated the data, so you're much better off running the Ruby interpreter directly. That's a problem if you have a local built Ruby, not installed, and you'd otherwise run it with a script like runruby.

With trial and error, you can figure out which environment variables to set to run Ruby, from the Ruby dir, with GPerfTools active, running optcarrot. You cloned Ruby and optcarrot into two directories next to each other, so optcarrot is at "../optcarrot" for me. Here's the command I use when I run it:

PATH=.:/usr/local/bin:/usr/bin:/bin:/usr/sbin:/sbin RUBYLIB=.:.ext/common:.ext/x86_64-darwin15:lib CPUPROFILE=/tmp/prof.out ./ruby ../optcarrot/bin/optcarrot --benchmark ../optcarrot/examples/Lan_Master.nes

Note the "CPUPROFILE" variable toward the end - that turns on GPerfTools profiling and tells it what file to write to. In this case, I chose "/tmp/prof.out".

Troubleshooting: if Ruby can't find its libraries, you'll need to change PATH and RUBYLIB. If you're not sure what to change them to, change your runruby script near the end, line 105 for me, and "STDERR.puts ENV.inspect" to see what your environment variables should look like. You can run optcarrot with runruby to see what it uses ("./tool/runruby.rb ../optcarrot/bin/optcarrot --benchmark ../optcarrot/examples/Lan_Master.nes") Then, put in your variables instead of mine from the ones you printed to the console.

If you run optcarrot and a /tmp/prof.out file appears... You win! Now you have profiling data. You can move on to "Seeing the Results" below.

More troubleshooting: if it doesn't work, you may want to clean your Ruby directory and rebuild:

git clean -dxf
export LIBS="-lprofiler"
export LDFLAGS="-Wl,-no_pie"
autoconf && ./configure && make clean && make && make check
unset LIBS
unset LDFLAGS

The "git clean" line means "destroy any files that git didn't put here." It cleans out everything a "make clean" would, but also all caches, logs, configurations... Even the configure script itself. It's the equivalent of blowing away your repo and re-cloning, but with less network traffic.

But it blows away the configure script, so you have to run autoconf to regenerate it, and then you'll get a very slow full rebuild. So only do this if you think you need it.

Seeing the Results

So, that's cool. It's kind of neat seeing the file appear in /tmp/prof.out. But what can we do with it?

We'll use pprof, part of GPerfTools. Fair warning: it's a little rough around the edges. If you use it much, you may find yourself reading its Perl source regularly. Pprof isn't amazing for weird corner cases like "you made a typo in the filename for the profiler output" and other "unlikely" situations. On the plus side, it's simple enough that with just a little Perl know-how, or Ruby know-how and some squinting, you can usually figure out what it's doing.

To run pprof, give it your binary's location, the profiling file, and what kind of output you want. Here's a simple example:

pprof ./ruby /tmp/prof.out --text

That should print out examples of what functions are taking the most time, like this:

The first column is how many samples landed in that function but not others that it called. The second column is what percentage of CPU time was spent on that function but not any other functions it called. The third column is a running sum - the total percentage of CPU time that's accounted for by this function and all the ones above it in this sort order (see how it always goes upward on every line?) The fourth and fifth columns are cumulative -- that is, the samples and percent of CPU time used by this function, plus everything else that it called.

The fifth-column percentages don't even vaguely add to 100% - they're cumulative, so they include that function and everything under it. Since vm_exec_core does a lot of calling rby_ary_push, for instance, they wind up with significantly more than 100% of total CPU time between them, because the shared time is double-counted.

(And obviously, last on the line comes the function that's being called, or a big hex number like "0x00007fff9b5eb273" if pprof can't figure out what was getting called there. You won't usually see static functions here, but that's because they're usually inlined -- their addresses are similar to normal function addresses and don't start with 0x000007fff. Addresses starting with that prefix seem to be on the stack. Perhaps the EIP register or ESP register are being used for something else briefly, which seems like it would confuse GPerfTools method of sampling.)

Troubleshooting

If you see only hexadecimal numbers instead of names, you're either not getting debugging symbols, or you didn't turn off PIE (see above.) You'll need to rebuild Ruby, possibly clean from nothing.

This is what that failure looks like:

Think it might be a problem with debug symbols in your Ruby binary? Pprof just uses "nm" for that, so run "nm ./ruby". If you see a bunch of function names, your Ruby binary is fine. Here's what that looks like:

More Fun Output Formats

Pprof can output graphical call graphs. They're fun, but I personally find them a bit impractical. But if you'd like to see and you installed Graphviz via homebrew above... Go ahead and run the same thing, but with "--web" instead of "--text".

pprof ./ruby /tmp/prof.out --web

This should create a nice svg file, also in /tmp, and open Safari to view it (see below.) If instead you got a warning about not having "dot" installed, that means Graphviz wasn't installed, or isn't in your path.

In fact, go ahead and run pprof --help and look at all the output types. I'll wait.

In general, pprof can output line numbers for call sites... But mostly, it doesn't do that on Mac, which lacks the addr2line command-line utility. If I can get gaddr2line working, perhaps you'll get another blog post on it. So: if you get question marks instead of line numbers from the Ruby source code, that's expected.

Play around with pprof - this is all poorly documented, but the trial and error is pretty good.

What Does All This Tell Me?

This should nicely break down where Ruby is spending its time. It's a sampling profiler, so the accuracy is pretty good. If you remember profiling optcarrot before, the output above should make sense -- optcarrot spent its time calling array appends, and Ruby is spending its time on rb_ary_push.

From here on out, you should be able to use this and figure out what Ruby's doing.

And that's what we both wanted, right?


Configuring the Ruby Source Code for Profiling... And Everything Else

I'll be talking a fair bit about configuring the Ruby source code... And I'll show you how to do it as well. With luck, by the end of this post we'll be able to do lots of profiling, setting Ruby code options and whatnot.

A lot of this was occasioned by me trying to use GPerfTools and Instruments... Which turn out to need some configuring.

(This post is basically for Unix, Mac and environments that are set up the same way like MinGW. If you're using an IDE and/or Visual Studio tools, it's probably not going to be a perfect match for you. And if you already know C, Make and Configure really well, and you already have a pretty good idea how the Ruby source code gets configured... You may not learn much here, but please feel free to critique in the comments below!)

The Basics

If you're a Ruby programmer, you may not use C libraries very often. They can be painful. A big C project such as the Ruby interpreter (which is written in C) does a huge amount of checking what's available on your platform, what compiler options and flags are available, what functions are available in what libraries and hundreds or thousands of other things... I wrote about the problems with just OpenSSL (only one of those libraries) not long ago.

The way C solves this is with a long list of possible options, flags and dependencies. A program called "autoconf" builds a giant bash script called "configure", which builds a Makefile, which allows you to build, test and install Ruby. The fact that autoconf, bash and Make are essentially their own individual languages will probably seem barbaric if you're a Rubyist. But this all started so long ago that, um... Well, okay, we only pretend it ever made sense. And Ruby can't do it in Ruby because first you have to build Ruby. But autoconf/configure/make is available nearly everywhere, and mostly works. Ruby, like most other large C projects, uses this system.

The basic short version of "what do I do?" goes like this:

autoconf # if there's no configure script in the current dir
./configure# with options, sometimes
make # build the software
make check # sometimes called "make test" or similar
make install # to copy the program into place

This means that when you want to change how Ruby is built, you may need to change things during configuration, or during make, by setting environment variables for various things... It can be complicated. So let's talk about how that happens.

Command Line Arguments

The configure script takes a bunch of command line arguments. Some configure scripts use them for turning features on and off -- Ruby does a little of that, too. But it's not a coincidence that I didn't mention configure scripts when talking about fixing OpenSSL. You can use them to do a few things, though. Here are some chunks of the output of "./configure --help":

If this seems cryptic... You're not alone. It can be hard to figure out how to set an option. So let's talk about some Ruby-relevant ways to do that.

Compiling and Linking

When you build a C program, there are (usually) two passes. The basic C source files get compiled from a .c file into a .o file, called an "object file", which is an intermediate not-yet-runnable chunk of binary code. You can make an object file (or many of them) runnable by putting those pieces together into a single binary with a tool called a linker.

Or you can give the compiler the names of all your .c files originally (not just one,) and it will automatically compile them behind the scenes and run the linker for you. That's good too.

Most project do some of each -- building one .c at a time, or putting them all together in one command. Which means that the configure-and-Make stuff above needs to know which flags get used in which ways, because it needs to pass compiler flags or linker flags, but not the other kind. So we'll talk about several kinds of flags... And the difference between them is basically "compiler, linker or both?"

If you're trying to use a language feature, OS tweak or library that you found online, you'll need to know which type of flag it is. Sometimes you don't know and you have to use trial and error.

Here are some example types of flag, which I also got from "./configure --help":

Compiler Flags

The basic compiler flags, the ones that aren't meant for the linker, go into an environment variable called CFLAGS. There's a sort of "extra CFLAGS" variable to Ruby's configure called "cflags." Yeah, they're different :-/ I recommend exporting the cflags variable before you run configure, which should add the flags you want.

For instance, want to add profiler information with the "-pg" compiler flag? You could do this:

export cflags="-pg"
./configure && make clean && make# build Ruby
unset cflags # Don't leave this sitting around

If you set CFLAGS instead of cflags, it'll replace the set Ruby uses instead of adding to them. You probably don't want to do that, since they include a lot of debugging information, compiler warnings and optimization flags that you probably don't want to lose.

Sometimes, Ruby already uses a given flag. It can be bad if you add a flag that conflicts with something Ruby already uses. So there are some Ruby-specific additional variables such as "debugflags" for specific kinds of compiler flags. Unfortunately, you may just need to read the configure source code (see "configure.in" in the Ruby source) to find these... The example below is to set a compiler flag for debugging information manually. Otherwise, Ruby would do it for you. And if you put it into cflags, you and Ruby would both do it, which comes out badly.

(You could also figure out what goes in CFLAGS and replace what Ruby would put there. If so, caveat emptor!)

export debugflags="-g3"
./configure && make clean && make
unset debugflags

Similar option types include optflags for optimization and warnflags for code warnings.

Linker Flags

We mentioned that some flags get sent to the linker, not the C compiler. For instance, MacOS has Address Space Layout Randomization (MacOS uses a variant called "PIE," for Position-Independent Executable.) This feature can make it very hard to debug or profile, because all the functions move around.

But you can turn it off with a linker flag, "-no_pie". And you can tell the compiler to pass that linker flag through with "-Wl,-no_pie" since there's no compiler flag for it. That compiler option means roughly: pass the following "-no_pie" to the linker without trying to make any sense of it.

You do the same as above, but pass it in LDFLAGS instead of CFLAGS so that Ruby will use it whenever it's invoking the linker:

export LDFLAGS="-Wl,-no_pie"
./configure && make clean && make
unset LDFLAGS

Library Flags

Sometimes you want to add in a library, one that Ruby otherwise wouldn't use. I'll use the example of GPerfTools' profiling library, because hey, I have a nice "how to profile" theme going here.

export LIBS="-lprofiler"
./configure && make clean && make
unset LIBS

This can also be used with a "-L /path/to/files" (capital L, not lowercase l) to make Ruby look for existing libraries in new places. This will get passed to the compiler, but not when just making an object file -- only when it creates a binary.

About That Title

If you want to profile with GPerfTools or Instruments, you'll need to use the option above to turn off PIE. If you want to profile with GPerfTools specifically, you'll need the "-lprofiler" option. So here's the "TL;DR" version of this article:

export LDFLAGS="-Wl,-no_pie"
export LIBS="-lprofiler"
autoconf && ./configure && make clean && make
unset LIBS
unset LDFLAGS

You may need to "brew install autoconf" or the equivalent as well. And you already have XCode, right? And... Well, let's say that having a full set of C development tools is another whole blog post, if you haven't done it already.

But What If...?

Naturally I haven't discussed every possible configuration option here. The next time you'd like to remember how amazing it is to just work in Ruby, I recommend configuring a big C project of any description. But in case you need it, here are some places you can look for Ruby knobs and levers to fiddle with, roughly in the order to check:

  • Just Google your problem
  • Arguments to ./configure
  • One of the environment variables above
  • Google your problem again, with what you learned
  • Check the Makefile
  • Check the source to ./configure
  • Google your problem one more time
  • Dive into the Ruby source

Happy Rubying!


Configuring Ruby on MacOS with OpenSSL

If you, like me, use MacOS and Homebrew, you may have had some trouble configuring Ruby from source - and maybe even more if you don't use Homebrew. You may also have gotten some odd error messages when you tried. I had some trouble on El Capitan, but a quick Google search will find many weird errors with OpenSSL and Ruby over many years and many versions. RVM goes so far as to download its own OpenSSL and link against it when it builds.

Of course, that doesn't help you if you're building from source, without using RVM.

How Do You Check?

First off, let's talk about how you see if you have openssl working. You *can* run "make check" in your Ruby source directory, but that's quite slow. Better is to start up irb and require "openssl". If Ruby can't find it, that means it didn't get built -- or your path is wrong. You can require something else to make sure it's not a path problem.

$ irb
2.3.1 :001 > require "tsort"
 => true
2.3.1 :002 > require "openssl"
 => true

(I required "tsort" just as a way of showing that, yes, my standard Ruby libraries were available.)

You can also cut that down to a one-liner by having Ruby evaluate code from the command line:

$ ruby -r openssl -e 'print "Working\n"'
Working
$

Okay, maybe I just really like one-liners :-)

What If It Doesn't Work?

Extensions don't always rebuild properly if Ruby can't detect the libraries. Specifically, configure doesn't always seem to figure out when it's been looking in the wrong place. So just re-making will often not rebuild Ruby's OpenSSL extension properly if it didn't get detected right the first time. This will manifest as a C error about incompatible prototypes for HMAC_CTX_copy, a function you've rightly never heard of and don't care about. That's because Ruby is using a very old, slightly wrong version of this function in its chunk of "you don't have OpenSSL" stub code.

You can track this down to a few old commits in 2008 (commit a8a111 in Ruby GitHub, and commit 87d524 in OpenSSL, not that I checked or anything.) But if you're getting prototypes not matching on HMAC_CTX_copy, it's because Ruby has the OpenSSL extension half-configured. Kill it with fire. If you're cloned from the Ruby GitHub repo, that looks like this in your Ruby source directory:

git clean -dxf
autoconf
./configure
make
make check

That first incantation, "git clean -dxf" means "destroy every file that wouldn't be there after a new clean git checkout." Even stuff in .gitignore. If Git didn't put it there, destroy it. If you wonder if your local Ruby checkout might be in an inconsistent state, I recommend that command highly. Of course, you'll also wait quite awhile for everything to be configured and built.

However, that will make sure you're seeing the OpenSSL that's actually available on your system instead of one that configure saw and cached several versions ago.

(Is it a problem that Ruby has some of the wrong prototypes for OpenSSL functions in its "you don't have OpenSSL" stub? Not really. They're very close. And you'll only see the compiler complain if you pull in both sets, which is an error, and a sign that things are already wrong. It's actually kind of nice, because you never wind up with a compiled-but-half-functioning Ruby with part stubs and part real OpenSSL.)

Any Hints on Why?

OpenSSL is one of a number of Ruby "extensions" which get compiled along with your Ruby. Ruby will try to build them, but may not if it can't find needed libraries, or if something fails when Ruby tries to compile it.

These extensions live in your Ruby source tree under the "ext" directory:

There may be a "mkmf.log" directory in any of them -- especially if something failed to build. You can see how the extensions above may not be around if something they need isn't there (Win32ole on a Mac, say, or zlib or openssl on a computer without those libraries installed.)

If you're basically C-literate, the mkmf.log file may be able to tell you that it can't find the library, or that there's an incompatibility. May I recommend not digging too deep in those cases unless you know OpenSSL quite well? That way, madness lies. Still, opening up mkmf.log and reading the last few entries can sometimes be quite useful ("wait, it's finding what version of OpenSSL? In what directory? Why is that there?")

It's possible to rebuild just the OpenSSL extension instead of all of Ruby as a way to see if you got the configuration right. I recommend not doing that. It's easy to wind up with a half-configured setup, some stuff cached by configure and passed in, and otherwise something that only sort-of works, and which you'll never be able to replicate if you ever need to build Ruby again. When possible, build clean and from the top level, even if it's slower, so that you'll be able to do it again later if you need to.

Homebrew? From Source?

I did a fair bit of uninstalling and reinstalling openssl in Homebrew, and from source. As it turns out, that wasn't my problem here. But in case you need it:

$ brew uninstall openssl

# And in the OpenSSL source directory:

./config --prefix=/usr/local --openssldir=/usr/local/openssl
./Configure darwin64-x86_64-cc
make depend
make
make test
make install
cd /usr/local/include && ln -s /usr/local/ssl/include/openssl .


What If It Still Doesn't Work?

Ruby can be picky on a Mac about picking up OpenSSL, which uses a slightly funky directory structure for a library anyway. I tried a bunch of things with setting LIBS when configuring, to no avail.

It turns out there's a utility already on your Mac that Ruby will use and that specializes in this sort of thing: pkg-config.

There's a nice blog post that explains how this works, but the sort answer looks like this:

export PKG_CONFIG_PATH=/usr/local/opt/openssl/lib/pkgconfig:/usr/local/lib/pkgconfig

By telling pkg-config exactly where to find OpenSSL and to look there first, Ruby finds it, and everything works... Almost.

You should put that in your ~/.bashrc file, so that it always happens. That way, next time you build Ruby it will just "magically work," instead of you having to remember where you read this blog post.

And When My Tests Fail?

All of that gets you almost all the way there. But when you run all the Ruby tests, such as with "make check", four will fail with timeouts on incoming network connections. And, if you're lucky, you'll get a little pop-up window telling you that Mac OS isn't so sure that your process should just get to open incoming sockets. Security!

Mac comes with something called Mac Application Firewall, which will cause some of Ruby's OpenSSL tests to fail, if you have it on.

Short answer: go to the "Security and Privacy" control panel, to the "Firewall" tab, and turn it off. You'll need to open the little lock icon at the bottom to make changes, just like always.

However, now it should be working!

What If It's Still Not Working?

I can only tell you what worked for me. But here are a few more possibilities that didn't help me, but might help you.

You can uninstall and reinstall OpenSSL via Homebrew. This will help if your version is damaged.

You can install a new OpenSSL from source, with the commands above. This will help if you're using the wrong version.

You can install Ruby via RVM. Remember that "rvm install ruby-head" will grab the latest, so you're not limited to released, stable versions. RVM has a lot of workarounds to get Ruby compiled with OpenSSL and downloads and configures its own, so it's often the easiest. Also, even if your local system OpenSSL is broken somehow, RVM won't be using it, so that may be a workaround for that problem. Ruby-build can also work for this.

You can install OpenSSL to a different directory. In the "configure OpenSSL from source" commands above, I put it under /usr/local. But you can put it directly under /usr, for instance, or otherwise try a place that might be easier to find.

Final Thoughts

If you can, install via RVM or ruby-build to avoid doing this yourself.

If you need latest source, but not often, still use rvm or ruby-build.

If you need to build locally, have pkg-config do the configuration, don't do it yourself.

If you still have to configure it yourself, make sure to "git clean -dxf" to avoid even the slightest chance of a half-cached older configuration.

If you'll need to build Ruby again, put the "export PKG_CONFIG_PATH=/usr/local/opt/openssl/lib/pkgconfig:/usr/local/lib/pkgconfig" into your ~/.bashrc file so it happens always, not just this one time.

In short, Ruby's code is part of the C ecosystem, with all the usual library-based problems that entails. If somebody else can do part of the configuration work for you, please let them :-)


A Little Ruby-Land Profiling with StackProf

I'm looking at Ruby performance lately. Aaron Patterson was awesome when I asked him about Ruby performance and his interview -- he pointed me at a great but Linux-specific Japanese blog post about how to profile Ruby itself. The program being used, called optcarrot, is a headless NES emulator that the Ruby core team are using as a CPU-intensive optimization target. Thus "optcarrot" == "optimization carrot", the target they're trying to optimize. Cute, right?

I'm on a Mac, which seems to lack most profiling tools (e.g. no gprof) and the existing one or two like XCode's Instruments seem fairly command-line-unfriendly and Makefile-unfriendly. But while I learn to use DTrace for profiling and get a Linux VM set up with other profiling tools, I can also check out the Ruby-side performance. Let's talk about that.

(One confusing point: there's the performance of the Ruby interpreter itself, and then the performance of the Ruby code running in the interpreter. Today's post is about the code running in the interpreter. So the function names and durations are from the optcarrot NES emulator, not the internals of the core Ruby language - yet. Capisce?)

The beginning of that Japanese post mentions stackprof, which I hadn't used before. I'm enjoying it more than perftools.rb or ruby-prof, and it's been much easier to set up. Let's talk about how to use it.

I got stackprof set up in a locally-compiled development Ruby. I'm not going to say too much about that here - it's kind of painful, and I don't recommend it without a good reason. So maybe I'll post about it later. Today, let's just talk about what stackprof shows us about optcarrot.

Stackprof needs to be in the local ruby, so "gem install stackprof" to make that happen. You may need to put it into a Gemfile with "gem stackprof" -- I did that in optcarrot. Then it wants to be required and configured. In optcarrot, you can do that in the bin/optcarrot file. Here's the original file:

#!/usr/bin/env ruby

# I'm too lazy to type `-Ilib` every time...
require_relative "../lib/optcarrot"

Optcarrot::NES.new.run

end

And here's the version with stackprof. Pretty simple:

#!/usr/bin/env ruby

require 'stackprof'# added

StackProf.run mode: :cpu, # added
interval: 1000,
out: '/tmp/stackprof_optcarrot.dump' do

# I'm too lazy to type `-Ilib` every time...
require_relative "../lib/optcarrot"

Optcarrot::NES.new.run

end

Okay. So what's it do? Well, run optcarrot again, just like before... If you're not running a funky local Ruby, that's probably just "ruby bin/optcarrot --benchmark examples/Lan_Master.nes". If you need to instead add a bunch of non-standard includes and stuff so that Ruby can find its local standard library, you have my sympathies :-)

Once the run works, you should see the file that's listed in the StackProf.run line. I used /tmp/stackprof_optcarrot.dump as the filename, but you can pick what you like.

$ ls -l /tmp
total 2272
drwx------3 noah.gibbswheel102 May 31 16:35 com.apple.launchd.5JyKIrJXHi
drwx------3 _mbsetupuserwheel102 May 31 16:35 com.apple.launchd.6AV1lzEddb
drwx------3 _mbsetupuserwheel102 May 31 16:35 com.apple.launchd.RhIpa252Cv
drwx------3 noah.gibbswheel102 May 31 16:35 com.apple.launchd.yH43wuq7kM
-rw-r--r--1 noah.gibbswheel10236 Jun9 15:12 stackprof_optcarrot.dump

What do you do with it?

The most useful is to ask it what used most of the performance:

$ stackprof /tmp/stackprof_optcarrot.dump --text --limit 10
==================================
Mode: cpu(1000)
Samples: 3625 (1.01% miss rate)
GC: 10 (0.28%)
==================================
 TOTAL(pct) SAMPLES(pct) FRAME
2854(78.7%)2854(78.7%) Optcarrot::PPU#render_pixel
 271 (7.5%) 271 (7.5%) block (3 levels) in <class:PPU>
 218 (6.0%) 109 (3.0%) Optcarrot::PPU#setup_lut
79 (2.2%)79 (2.2%) Optcarrot::PPU#setup_frame
55 (1.5%)55 (1.5%) Optcarrot::CPU#fetch
26 (0.7%)26 (0.7%) Optcarrot::PPU#wait_one_clock
19 (0.5%)19 (0.5%) Optcarrot::PPU#update_address_line
6017 (166.0%)14 (0.4%) Optcarrot::PPU#main_loop
13 (0.4%)13 (0.4%) Optcarrot::PPU#evaluate_sprites_even
13 (0.4%)13 (0.4%) Optcarrot::PPU#load_tiles

Stackprof will also output files, graphviz output, flamegraphs, specific methods and more. See its GitHub page for more details.

So - what does that actually tell us? The PPU code is the "graphical" output (headless in this case) where it calculates all the output pixels. Optcarrot's documentation (see doc/benchmark.md) even warns us that the vast majority of the time will be spent in PPU#run and CPU#run. That makes a lot of sense for a game console emulator. The time is spent emulating the hardware.

The render_pixel function isn't terribly long (see lib/optcarrot/ppu.rb and search for "render_pixel"). But looking at that array append at the end, I had a sudden suspicion. I tried just commenting out that one last line of the function (yes, the emulator is useless at that point, but humor me.) Delete /tmp/stackprof_optcarrot.dump, run the emulator, run stackprof again and...

$ stackprof /tmp/stackprof_optcarrot.dump --text --limit 10
==================================
Mode: cpu(1000)
Samples: 2753 (1.18% miss rate)
GC: 14 (0.51%)
==================================
 TOTAL(pct) SAMPLES(pct) FRAME
 495(18.0%) 493(17.9%) Optcarrot::PPU#vsync
 259 (9.4%) 259 (9.4%) block (3 levels) in <class:PPU>
 258 (9.4%) 258 (9.4%) Optcarrot::PPU#render_pixel
 202 (7.3%) 202 (7.3%) Optcarrot::PPU#wait_one_clock
 137 (5.0%) 135 (4.9%) Optcarrot::CPU#fetch
 119 (4.3%) 119 (4.3%) Optcarrot::PPU#update_address_line
 113 (4.1%) 113 (4.1%) Optcarrot::PPU#evaluate_sprites_even
 110 (4.0%) 110 (4.0%) Optcarrot::PPU#setup_frame
 203 (7.4%) 101 (3.7%) Optcarrot::PPU#setup_lut
2786 (101.2%)98 (3.6%) Optcarrot::PPU#main_loop

Instead of 78% of the total runtime, render_pixel is down to 9.4% of the total runtime. So that array append is burning a great big chunk of our CPU cycles.

You can also verify this by asking stackprof to "zoom in" on the render_pixel method.

$ stackprof /tmp/stackprof_optcarrot.dump --text --method render_pixel

See the left columns? That single line is using 75.2% of the total runtime. So again, the array append is slow...

If I were trying to optimize the optcarrot NES emulator, I'd restructure that -- preallocate the array, so there's only one memory allocation? Don't use an array at all, and find some other way to handle pixel output?

But I'm not really trying to optimize optcarrot. Instead, I'm trying to optimize the Ruby internal operations that make optcarrot slow. And now I know -- those are dominated by arrays.

By the way - don't take the one-line-commented-out op count too seriously. That's dominated by PPU#vsync, but PPU#vsync winds up blacking the screen if render_pixel doesn't write output pixels. And that's an array append in a tight loop. In other words, if you take out the slow array appends in render_pixel, it will fill in with a bunch more array appends anyway. This is one of the hazards of modifying the code you're profiling - it changes the behavior.

In a later post, perhaps we'll return to that array append. I'm still figuring out how to optimize it. I suspect realloc() being slow, myself. And in the mean time, you have learned a bit about how to use stackprof, which is a pretty darned awesome tool.


Git Bisect to Find a Ruby Regression

Hi! My name is Noah. I'm AppFolio's new Ruby Fellow. Though I've been working on Ruby stuff for a long time, most of it hasn't been on the core Ruby language.

So: that means I'm getting up to speed. And I'm a compulsive blogger. So you'll get a series of posts about how to do interesting things with the Ruby code, and how to get started with it.

Today I'm looking at a minor regression in Ruby, and using git-bisect to find it. Care to follow along?

(@nalsh on Twitter points out that you can use tool/bisect.sh in the Ruby source if you're bisecting on a test that Ruby already has. It's even easier!)

I have the Ruby code checked out locally. I'm running the bug-reporter's example test, an "nth prime" example from Exercism.io. It succeeds on Ruby 2.2, and fails with an obscure "deadlock; recursive locking" error on the very latest Ruby (currently 2.4, commit d16ff5 in the GitHub mirror.)

To check if a given Ruby version is good or bad, I'm rebuilding Ruby and running the test via this incantation: "make && ./ruby -v -Ilib -I. -I.ext/x86\_64-darwin15 ~/Desktop/nth_prime_test.rb". The extra arguments are to use local libraries from the Ruby build directory on my Macbook. It'll be a little different if you're using Windows or Linux.

(Here's a time-saver of a tip: check your incantation by manually switching back and forth between the first "good" and "bad" revisions - that way you'll be sure that you're rebuilding the right things to get the bug after you weren't getting it, and vice-versa. That's very important when you're trying to isolate it. And checking all the revisions when your test doesn't work will waste your time.)

I started my "git bisect" on Ruby's git history:

$ git bisect start trunk # Trunk is bad, current (ruby_2_2) is good
$ make && ./ruby #... # Run the tests
$ git bisect good

After each "git bisect" command I make Ruby locally and run my test again. Then I either type "git bisect good" or "git bisect bad", depending whether I got the nasty deadlock error that I'm tracking down.

 $ git bisect good
Bisecting: a merge base must be tested
[7632a82d5750b7908bd173eda3268ecb0855b934] * gc.c (wmap_final_func): fix memory size shortage when realloc wmap. Fix SEGV during finilize of WeakRef on Solaris (though the SEGV could occur on all OS/platforms). [ruby-dev:48779] [Bug #10646]
$ make && ./ruby #... # Run the tests again

Git bisect, if you don't know it already, will look at the whole list of commits between your "good" and "bad" revision, pick one in the middle, and then let you test it to see if it's "good" or "bad". Each time you tell it, it will cut the range of commits in half again.

So it's a binary search algorithm, but you'll be playing the role of the "compare" operation :-)

If you hit a different bug, you can "git bisect skip" to say that that commit can't be tested... It'll take a little longer to find the bug because you had to rebuild Ruby just to find out that one commit wasn't good. But when you need it, use it. Also, there's always a weird tension about how much you rebuild. Do you "git clean -dxf && autoconf && ./configure &&..." (aka nuke it from orbit and redo everything)? Do you just remake as little as possible? This is one reason that it can be touch to just hand it a script and have it do the right thing, unless your script does a full nuke-and-rebuild, which can be very slow. I'm sure there's also a smart way to not rebuild rdoc every time, but I'm still getting the hang of lots of Ruby rebuilding ;-)

WhoDunnit

Did you read the original bug? Wondering why innocent-looking code having nothing obvious to do with threads is getting a bizarre mutex error with some Ruby versions?

The Mutex exists because the example code uses Prime, which is a Singleton, which locks itself when getting the single, global instance of Prime that exists. The commit that git-bisect finds looks relevant: commit d2487e removes an obsolete Prime.new operation. It also switches Prime to be a Singleton. The old version of Prime used an internal @the_instance variable to track itself. The new ones uses Singleton, and a mutex, and the code where it gets that deadlock error. Ah!

The deadlock error on the mutex basically means "this mutex is already locked by you and you're locking it again" -- which can never succeed. Frequently it's caused by... recursion.

In this case, Prime got rid of its .new() method. The Singleton class, in Ruby, makes its instance using .new(). Worse, the sample code winds up defining .new() as well. So when it calls .new(), Prime winds up calling .instance(), which calls .new(), which calls .instance()...

And so it looks like the problem is just the code in question defining a .new() method. It's technically a regression, but is it one that matters? Hm...

Want to see what happens? Watch the bug for updates!


Ruby Fellow Hired!

At the end of 2015, Matz announced that Ruby 3 will have a focus on performance (a.k.a Ruby 3x3). We welcomed this news and wanted to help.

Today, we are happy to announce that we have hired Noah Gibbs (@codefolio) to work full-time on Ruby performance. Noah has a strong background in C / C++ and low-level programming. He is also no stranger to the Ruby / Rails worlds having worked on a number of large scale Rails applications, presented at conferences / meet-ups, and even written a book on the Rails

We are thrilled to have Noah join "the many performance wonks in the community who work tirelessly to make everything faster."


Ruby 3x3: Ruby 3 will be 3 times faster

At RubyConf 2015 in San Antonio, Yukihiro "Matz" Matsumoto announced Ruby 3x3. The goal of Ruby 3x3 is to make Ruby 3 be 3 times faster than Ruby 2. At AppFolio, we think this is awesome and want to help.

[Update: watch Matz's keynote ]

We have been using Ruby for the past nine years. Like most people, we initially came to Ruby via Rails. One of the main ideals of Rails was that developer happiness and productivity are more important than raw system performance. And Ruby supported that quite well. It's easy to write and easy to read. It follows the principle of least surprise. It's flexible and dynamic and perfect for DSLs. It even supports "seattle style".

But for all of Ruby’s virtues, it lacks speed. This isn't to say that performance hasn't improved over time: it has. But is Ruby fast yet? No. And today, the performance expectations are very different from those of nine years ago. Customers now expect more responsive web applications and APIs, developers expect a faster development environment (running rake, running tests, starting rails, asset compilation), and operations expects better utilization of cores and hardware resources. In other words, today we want developer happiness without sacrificing performance.

So, why hasn't Ruby been able to deliver better performance results? Jared Friedman argues that, in part, it's due to a lack of corporate sponsorship. In the case of PHP, it took Facebook to move it forward. In the case of JavaScript, it took Google to kick off the performance arms race. In the case of Ruby, Heroku has been sponsoring Matz, Koichi Sasada, and Nobuyoshi Nakada. That's great, but that's not enough. The development and maintenance of an entire programming language is a massive job. Performance optimization is a challenging problem, and it's only one of many important concerns in that effort. The Heroku three and the rest of the Ruby core team are going to need more support in order to satisfy today's performance expectations.

So, we at AppFolio would like to help. We have reached out to Matz and are proud to be part of the Ruby 3x3 effort.

RubyConf 2015 keynote.png

Our plan is to hire a full-time engineer to work with the Ruby core team on performance. Ideally, we would find someone who is not only a strong C programmer but also has experience with one of other VMs out there (e.g. JVMs, JavaScript VMs).

So, what are the possible ways to make Ruby faster? Here are a few high level ideas:

  • just-in-time compilation: a Ruby JIT is a very promising idea. After all, Java and JavaScript solved their performance issues with the introduction of JIT compilers. Interestingly, there was one experimental attempt at a Ruby JIT with RuJIT, a trace-based JIT. RuJIT showed 2x5x performance gains but was very memory hungry. Perhaps, the RuJIT work can be revisited and improved. Or perhaps we need a new approach with a method-based JIT.
  • ahead-of-time compilation: the concept is to reduce the time the Ruby VM has to spend before actually running a program. Aaron Patterson has already played around with this approach a bit.
  • concurrency: despite the common misconception about the GIL, Ruby does support concurrency quite well in cases where IO is involved (making HTTP requests, reading a file, querying the database, etc). However, the Thread is a low level primitive, which makes it difficult to write concurrent programs correctly. There are gems like concurrent-ruby that provide higher-level abstractions, but we need these higher-level abstractions in Ruby itself to gain adoption and greater performance.
  • optimize / remove GIL: in order to allow Ruby to be a viable option in the parallel computing realm, we need to remove the GIL.
  • profile-optimize-rinse-repeat: of course, we cannot overlook the bread and butter of profiling existing parts of code and finding ways to optimize bottlenecks. 

Let us know if you or someone you know is qualified and interested in the above problems (paul dot kmiec at appfolio dot com AND matz at ruby-lang dot org). 

We're just one company among many whose businesses are built on Ruby, so we call out to the others:

Join us and help make Ruby 3x3 a reality.

P.S. If you'd like to contribute to the Ruby / Rails community at large, we suggest also taking a look at RubyTogether.org

P.P.S. Thanks to John Yoder and Andrew Mutz for helping shape this post.

Thinking About Innovation

Drawing a Blank

It’s a brisk autumn morning. You just woke up and you lay in bed waiting for your brain to load the essential bits of information required to start your day. Suddenly, you remember. You just finished a big project and nothing new will be lined up until sometime tomorrow. Today is a free day and you get to work on whatever you want. You get out of bed and start getting ready with a growing sense of anticipation. The sun is shining, there’s an invigorating chill in the air, and a flood of ideas begins to fill your mind. Anything is possible.

You’re one of the first people to show up in the office this morning. You sit at your desk staring at the blinking cursor of your text editor. What to do...so many options. “I could learn a new front end framework. Or I could write that one Rails app I’ve been thinking about in my spare time. Maybe I should learn Haskell! Or I could try to untangle that horrible piece of code that’s been nagging at me.” Then, the first email of the day arrives in your inbox. It looks important and you figure you’d better respond to it so that it isn’t hanging over your head the rest of the day.

A few hours later it’s time for lunch and you realize you’ve spent the majority of the time fending off emails and trying to figure out where to get started. Half of your cherished free day is gone and you’ve got nothing substantial to show for it. Anything was possible, but now it seems like nothing is possible.

The Raw Materials of Innovation

Why is innovation so difficult? On the one hand, many of us have endless lists of ideas we’d love to spend time pursuing. We go about our day-to-day jobs yearning for a moment of freedom when we could forget about our responsibilities and try something totally new. And yet, when that moment presents itself to us, we feel unprepared or lost. The things which we thought would have motivated us seem to lose their appeal. Our interest fades and we hop from one idea to the next, never really getting anything done.

I recently attended a workshop on innovation and came away with some useful ideas for making innovation happen. One of the most valuable things I came away with is a more concrete definition of what innovation actually is.

So what is innovation? What makes something innovative? The common belief (or at least my prior belief) is that innovation is a novel idea - doing something that hasn’t been done before. So, if we want a group of people to be innovative, we should get together in a room and have a brainstorm of cool ideas. The more unique the idea or the approach, the more innovative.

The speakers at the workshop I attended provided a more useful definition. An innovation is the fulfilling of a customer’s need with a technology in a novel way. So, there are two essential components to innovation: customer needs and technologies. Innovative ideas result from the combination of needs and technologies in new ways.

At a previous job, I spent a couple of years working on a project which, in the end, had no real customer. We solved many technical challenges with this project and I’d even say that many of the ideas in the system we designed were quite novel. But, according to the definition above, we weren’t truly innovating because we weren’t solving a need. We were just building technology.

Customer needs and technologies are the raw materials for generating innovative ideas. This may help us better understand why it can be so difficult for us on that glorious free day to get beyond a blinking cursor in an empty text editor. Perhaps we lack the necessary building materials. Think about the times when you’ve had the best ideas, been the most engaged with your work, and been the most productive. For me, these times occur when there is a clear need and I’ve got (or can learn) the technical know-how to meet it.

So, the answer to moving forward is not to have a better brainstorm session, it’s to acquire more information. Are you the person who knows all sorts of programming languages and frameworks but can’t think of any good use for them? You need to spend some time finding a real customer problem that you can match up with some of this technology. On the other hand, maybe you’ve got a list of complaints from customers and don’t know where to begin. In this case, you may need a better view of the technology landscape.

Finding the Need

It probably goes without saying that finding real customer needs takes work. Most software companies have a product team whose mission is to understand and evaluate the importance of customer needs. In such cases, it is crucial for product folks and engineers to work together as a team. In general, product will supply the customer needs and engineers will supply technology. Together, they generate innovative solutions by evaluating which technologies are the best fit for the needs.

The degree to which a team is able to innovate is dependent upon how deep a team can go with the customer need. The deeper the team goes, the wider the solution space and the more technologies there are that can be applied to the problem - hence, more opportunity for innovative ideas. Any product manager will tell you that customers love to provide solutions and rarely begin by talking about the underlying need. By asking the right questions, the team can gain access to the deeper problem. The customer may say he needs a better horse, but what he really needs is a faster form of transportation. Or maybe what the customer really needs to spend less time traveling to and from work. The pool of available solutions increases dramatically based on how the problem is framed.

The speakers emphasized that the best opportunities for innovation come from needs that customers don’t realize they have. These are the needs that have likely never been addressed by any combination of technologies. According to the speakers, a customer will never realize there is a need unless they perceive some alternative. So just asking customers about their needs is not sufficient because you are likely to wind up with a list of problems for which solutions already exist.

One remedy for this is actually quite simple: go live life with the customer. The longer you sit with a customer as they use the product, the more opportunities you will have to see the hidden needs. If you find that the customer is using the product in an unexpected way, this could also indicate a hidden need.

Finding the Technology

So you’ve lived life with a customer, you’ve found a high impact need, now what? The speakers described an interesting approach to finding the right technology for a truly innovative solution. First, think about the core problem that must be solved and ask yourself “what other industry has faced a similar challenge?” Try to think far outside of your own industry. Then, go talk to folks in that industry and see what they’ve done to solve the problem. See if you can take their solution and apply it within your own problem domain.

The speakers gave several fun examples of this approach. When NASA began designing their first space suit, they had difficulty attaching the fabric and metal portions of the suit. Apparently, this is a pretty challenging thing to do, especially when someone’s life depends on the strength of the fabric/metal interface. NASA looked outside the space and military industries for a solution. They found an unlikely partner in the Playtex corporation, a popular producer of women’s undergarments. The problem of attaching fabric to metal is common in the design of bras and NASA was able to leverage Playtex’s experience in this domain to overcome their design challenges. At the time, NASA was embarrassed to admit that a portion of their space suit was developed by a bra company, so they contracted out to another company with the understanding that the real work would be sub-contracted to Playtex.

When looking to other industries for technologies, it’s wise to ask the people you talk to, “who has a similar problem, but even worse?” This can lead you people who have already solved the problem in really creative ways. The medical division of the 3M corporation was looking for a way to help surgeons prevent incisions from getting infected. They asked surgeons, “who might have an even harder time with infections than you?” This led them to investigate veterinarians, battlefield medics, and surgeons who operate on patients whose immune system has been compromised by chemotherapy. The key innovation for 3M’s product ultimately came from these discussions.

Similarly, the development of anti-lock brakes in cars came from an industry with a more extreme version of the problem. In this case, it was the airplane industry. Almost everything about this industry is more extreme. The stakes are higher, the speeds are faster, and icy runways cannot be salted because salt can damage aircraft. This made it a great candidate for solving a similar problem with automobiles.

When Should We Innovate?

How deep should a team dive into the customer’s needs? Indeed, opportunity for innovation increases, but so does the uncertainty for the project. With a large solution space, the team could spend ages finding and evaluating available technologies. And there is no guarantee that any of these technologies will pan out in the end. At the same time, there is the potential for immense gains. What if the team discovers a solution that eliminates an entire class of problems for the customer? Or, what if they find a solution that allows them to move ten times as fast? These could be game-changers for an entire industry.

One answer is that it depends on the business context. Maybe there is a short window of opportunity to make some key sales. Providing a feature within this timeframe will allow the company to get the sales while they are still available. The product manager may decide that these sales are more valuable than the potential for innovation and therefore focus the team on the immediate need. This may make sense given the context.

I think there are two dangers to avoid when approaching a project in this manner. First, it’s possible for a team to jump to a solution too quickly under pressure from the context. They may overlook a very simple solution to a deeper need and add unnecessary complexity to the product. This danger can be somewhat mitigated by at least timeboxing a brief exploration of the solution space.

The second danger occurs when the context forces the team to approach every problem at a surface level. History is replete with examples of organizations that failed because they got locked into addressing customer needs at a single level. I’m thinking specifically of Blockbuster and Kodak right now. These companies were once immensely successful, but they continued to solve problems the same way. They were ultimately destroyed by innovations which met customer needs at a deeper level.

Innovating Within an Organization

It’s clear that a company must innovate in order to survive long-term. In the initial startup phase of a company there isn’t much to lose and everything looks like an opportunity. Entrepreneurship and innovation are center stage. The problem is that companies become increasingly risk-averse as they grow. There is no immediate reason to change the way things are done when a company is enjoying a period of great success - if it ain’t broke, don’t fix it.

The speakers at the workshop talked about the value of a storm in these cases. A storm is some event that causes the leadership in a large organization to question the future. Examples include a competitor success or a new technological breakthrough. These events provide the motivation to accept more risk and make changes. In my view, a reliance on storms does not seem like a great way to run a business. Storms are unpredictable and may leave too little time for an organization to adjust. On the other hand, you might try to generate artificial storms, but this will eventually erode trust within the business.

Innovation is uncertain because it involves questions like, “is this problem even solvable?” An innovative solution could take many years to implement. The key to innovation within a larger organization is the recognition that uncertainty is not the same as risk. Uncertainty comes from our inability to predict the future. Risk is the impact of this uncertainty to the business. If you can find ways to mitigate risk, then you can still innovate even in the largest companies.

How do you mitigate risk? The same way you would do anything else with an agile mindset: start small and work in small increments. Don’t ask for a big budget or a large team right off the bat. Instead, find ways to show progress at each phase with the minimal resources at your disposal. As you demonstrate progress you may find that the organization is more willing to invest in your idea.

The 3M corporation is often cited as a company with a culture of innovation. Employees within 3M are allowed to work on whatever they want as long as they fulfill their day-to-day responsibilities reasonably well. It’s an environment that allows time for curiosity and exploration. The Post-It note was invented by a chemist at 3M who stumbled upon a unique adhesive while performing some experiments as part of a side-project. He knew his technology could be useful for something and he spent the next decade trying to figure out what that useful thing was.

Innovating at AppFolio

So how does all of this connect with work at AppFolio? Our second company value is: Great, innovative products are key to a great business.

I see several ways we strive to embody this value. First, product and UX spend an insane amount of time with our customers, talking to them, watching them, and deciphering their needs. They visit customer offices, they hang out with customers at meetups, they talk on the phone with customers all day, and they give customers demos of prototypes and new features.

As an organization, we are learning more and more how to drill down to the deep customer needs and make those the focus of our engineering efforts. We generally work without strict deadlines and this gives engineers a bit more freedom to ask questions and explore.

AppFolio provides engineers with a few regular opportunities to innovate. Every other Friday is Future Focused Friday. This is a day when engineers are free from their day-to-day responsibilities. They may use this day of work however they wish, without any accountability. Some engineers spend the day reading a book to deepen their understanding of a particular technology. Other engineers have projects that they are working on. For example, one engineer built a web app for sharing appreciations of other employees with the company. Still other engineers work on improving some part of our infrastructure or product. One engineer recently implemented an optimization in our continuous integration system which cut the runtime of our test suite in half.

Future Focused Friday is a zero-risk day. It frees engineers to try something crazy, like programing a drone to perform a property inspection or create a wireless submetering device. Because this day is already set aside, it costs the company nothing extra. In fact, these experiments may prove to be future streams of revenue for the business.

AppFolio hosts two hack days each year. Hack Day is similar to Future Focused Friday in that engineers can work on whatever they want for the day, but Hack Day tends to emphasize team projects and includes members of the company outside of engineering. A lot of cross-pollination between various parts of the company occurs on Hack Day. It’s also just plain fun. There are costumes, funny presentations, and beer. This gives the day a feeling of lighthearted playfulness and creativity.

We’ve recently introduced a new event to promote innovation called Shark Week. During this week, teams present innovative ideas they think will create value for our customers to a panel of judges. The judges select the project they think will have most value and the corresponding team has one month to implement it.

These are some basic structures and events that aim to promote innovation here at AppFolio. But just providing events doesn’t automatically make innovation happen. It takes an atmosphere of playfulness, curiosity, exploration, and, as I argue in this article, intense focus on customer needs and technology.

It's a Wiring Problem

IMG_2616 I once had a mentor who liked to say, “If you can reduce it to a wiring problem, you’re half-way there.” It took me a while to really understand what this means and why it is useful advice for a software engineer. In this post, I’m going to do my best to explain it and provide you with some practical applications. I hope you find it helpful!

When we aren’t at work, we move around in a world of physical objects. Many of these objects are quite complex: airplanes, iPhones, refrigerators, and Ikea furniture. Some of these are composed of hundreds of thousands, or even millions of intricate parts (Ikea furniture), all delicately assembled in a very precise configuration. It’s easy to forget how complex some of these objects are because they present such a simple physical interface. To the consumer, the iPhone is just a solid flat rectangle.

Even easier to forget are the complex processes used to fabricate these objects. How many different vendors, machines, and stages are involved in the creation of an iPhone? It would take us a long time to count. When I was a kid, I loved the episode of Mr. Roger’s Neighborhood where they went on a field trip to the crayon factory. It amazed me that the creation of something as simple as a wax cylinder could require so much behind-the-scenes infrastructure.

Ok, so what does this have to do with my mentor’s favorite phrase and your work as a software engineer? As developers, we spend the majority of our time modeling the world around us in software. We model physical objects, processes, and relationships to name a few. We strive to break these things down into independent concepts that we then assemble together within a software system.

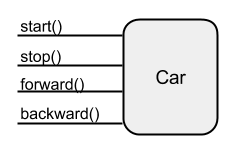
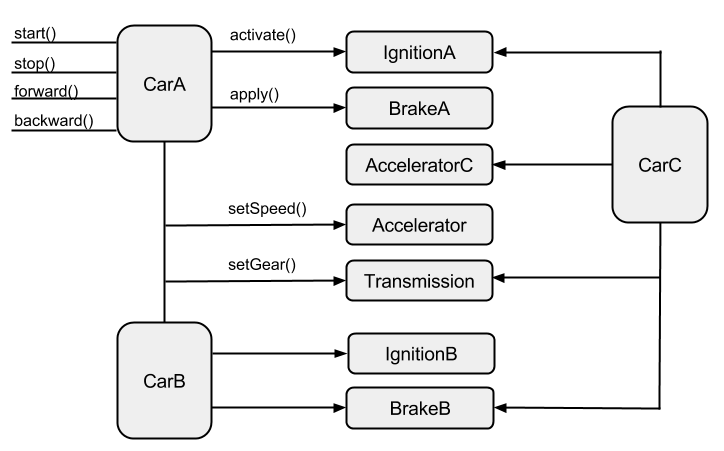
These systems can become just as complex (and perhaps more so) than the hardware configuration of an iPhone. If you’ve done your job well, then you can walk over to a whiteboard, draw out a whole network of software components, and show how these components relate to one another. Component A sends a message to component B which forwards it along to these three other components, C1, C2, and C3. These components perform callbacks on component B when they have finished their work, and so forth.

IMG_2613

Great! You understand how the software system will perform it’s job once the components have been arranged properly. But how were these components arranged in the first place? How did component A ever come to know about component B? How did C1, C2, and C3 come to know about the callbacks for B? The answer is that something had to wire them together prior to the interactions you drew on the whiteboard. You drew half of your problem on the whiteboard, the other half is wiring.

Now maybe my point is clear. Just as with a complex physical object, the components in a complex running software system must be meticulously wired together. And the machinery for performing this wiring can often be just as complex as the system itself. Whenever you are solving a problem using software, remember that you are actually dealing with two separate subproblems: modeling the domain and wiring the components. Now you might be thinking, “That’s not true. I’ve worked on complex software projects and didn’t have to think much about wiring.” I’m wondering whether the code for the project looked something like this:

class Pen
  def initialize
    @ink_cartridge = InkCartridge.new(ink_color: :blue)
  end

  ...
end

class InkCartridge
  def initialize(ink_color:)
    @ink = ColoredInk.new(ink_color)
    @ball_point = BallPoint.new
  end

  ...
end

class BallPoint
  ...
end

If so, then I’d say that the wiring aspect of the system is still there, but it’s somewhat hidden. In this example, the problem of assembling a ballpoint pen and the problem of using a ballpoint pen are intermingled. The pen is creating and storing a reference to the ink cartridge, the ink cartridge is creating the ballpoint, and so on.

In the physical world, I doubt you could find a pen that created and assembled itself. But, I see this type of design all the time in the software world; and it causes trouble, as the system’s design evolves, because it attempts to address two very different problems with a single solution. Your thinking, as a developer, is muddled as you write the software because you are constantly trying to solve two distinct problems at the same time.

To make matters worse, the single solution you devise binds the two problems together, making them inseparable. Now what happens if the requirements for how the components are arranged changes? You begin to compromise the integrity of your model to meet the demands of the wiring problem.

Instead of trying to solve both problems simultaneously, what if you focus on one problem at a time? You will need to solve both problems regardless of how you approach the design, but at least if they are separated, you will have the chance to give each problem due thought. First, focus on the primary goal -- how to model your problem domain in software. Once you can confidently draw a diagram of control flow through your components for various use-cases, it’s time to turn your attention to the secondary problem of wiring these components together.

So what tools do you have at your disposal for solving the wiring problem? Well, if we are attempting to address our two problems separately then the code for solving each of them should be separate. I typically refer to the code used to wire components together as a factory. Factories can take several forms, each with its own strengths and weaknesses. In the following sections, I will describe three forms of factories.

Class Factory Methods

Let’s go back to our ballpoint pen example and use a factory to pull out the wiring code. The code fragment below shows one way we might do this.

class Pen
  def self.create
    new(InkCartridge.new(ColoredInk.new(:blue)))
  end

  def initialize(ink_cartridge)
    @ink_cartridge = ink_cartridge
  end

  ...
end

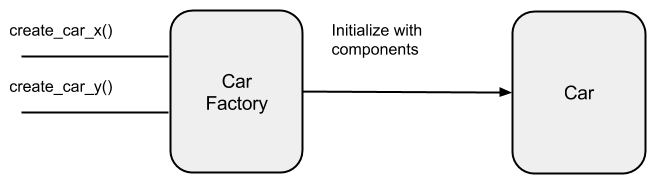
In this example, we’ve pulled the creation of the ink-cartridge out of the pen initializer and have added a new class method, create(). This method instantiates the ink-cartridge, injects it into the pen’s initializer, and returns the new pen instance. The pen initializer knows nothing about the ink-cartridge it is given. It just assigns the ink-cartridge to a member variable for use within the pen instance.

There are a few advantages with this simple refactor. First, it gives us options for how pens might be created in the future. For example, we might add several creation methods as the system evolves:

  • create_ballpoint_pen()
  • create_whiteboard_pen()
  • create_ipad_stylus()

Some have argued that software architecture is an exercise in deferring decisions and keeping your options open. If this is true, then our refactor supports good architecture because it has opened up a world of options while still keeping pen creation simple for the common cases. Users can take advantage of our factory methods, or they are free to write their own wiring code outside the scope of the pen class.

A second, related advantage is that this method gives us greater freedom to mock the ink-cartridge in test code. In your test setup, just create the mock object and pass it directly into the initializer. I recognize that there are mocking libraries in Ruby which allow you to stub class initializers so that they return mocks, but I find the injection technique much easier to understand, especially when you’ve got a test involving several pens.

The strength of this technique compared with other factory approaches is simplicity. It decouples the wiring from the main problem with very little extra effort. At the same time, it keeps the factory close to the class that it creates (it’s in the same file). Readers will have little trouble understanding how pens are created just by looking at the pen class.

This approach does have at least one potential downside -- it makes pen class directly dependent upon the ink-cartridge class. The two classes cannot be separated even though instances of the pen class don’t care what type of ink-cartridge they refer to. If you wanted to turn your pen class into a library, you would have to include the ink-cartridge implementation as well. This may or may not make sense depending on your context.

Factory Modules

Now consider the case where there are more than a few possible pen configurations. Rather than overloading your class with fifty different class factory methods, you might consider extracting this code into a factory module. You could take this further by grouping similar configurations in separate modules. For example:

module WhiteboardPenFactory
  def create_thin_expo_marker
    ...
  end

  def create_thick_expo_marker
    ...
  end
end

module PermanentPenFactory
  def create_standard_sharpie
    ...
  end

  def create_twin_tip_sharpie
    ...
  end
end

module BallpointPenFactory
  def create_standard_pen
    ...
  end

  def create_erasible_pen
    ...
  end
end

The strength of this approach is in the complete separation of wiring code from the problem domain. The pen class knows nothing in particular about the components of which it is composed and will not need to change when new pen variants are added to the system.

Similarly, the factory modules aren’t required to generate instances of the pen class. There may be, in fact, several pen classes with completely different implementations. Users of the factory modules needn’t be concerned with the specific type of pen that pops out of the factories, as long as each implementation adheres to a common interface.

The factory module approach does come at a cost. Because the wiring code is totally separated from the domain, readers will likely have a harder time understanding where and how pens are created, especially if our factory modules are spread across a large codebase.

Factory Classes

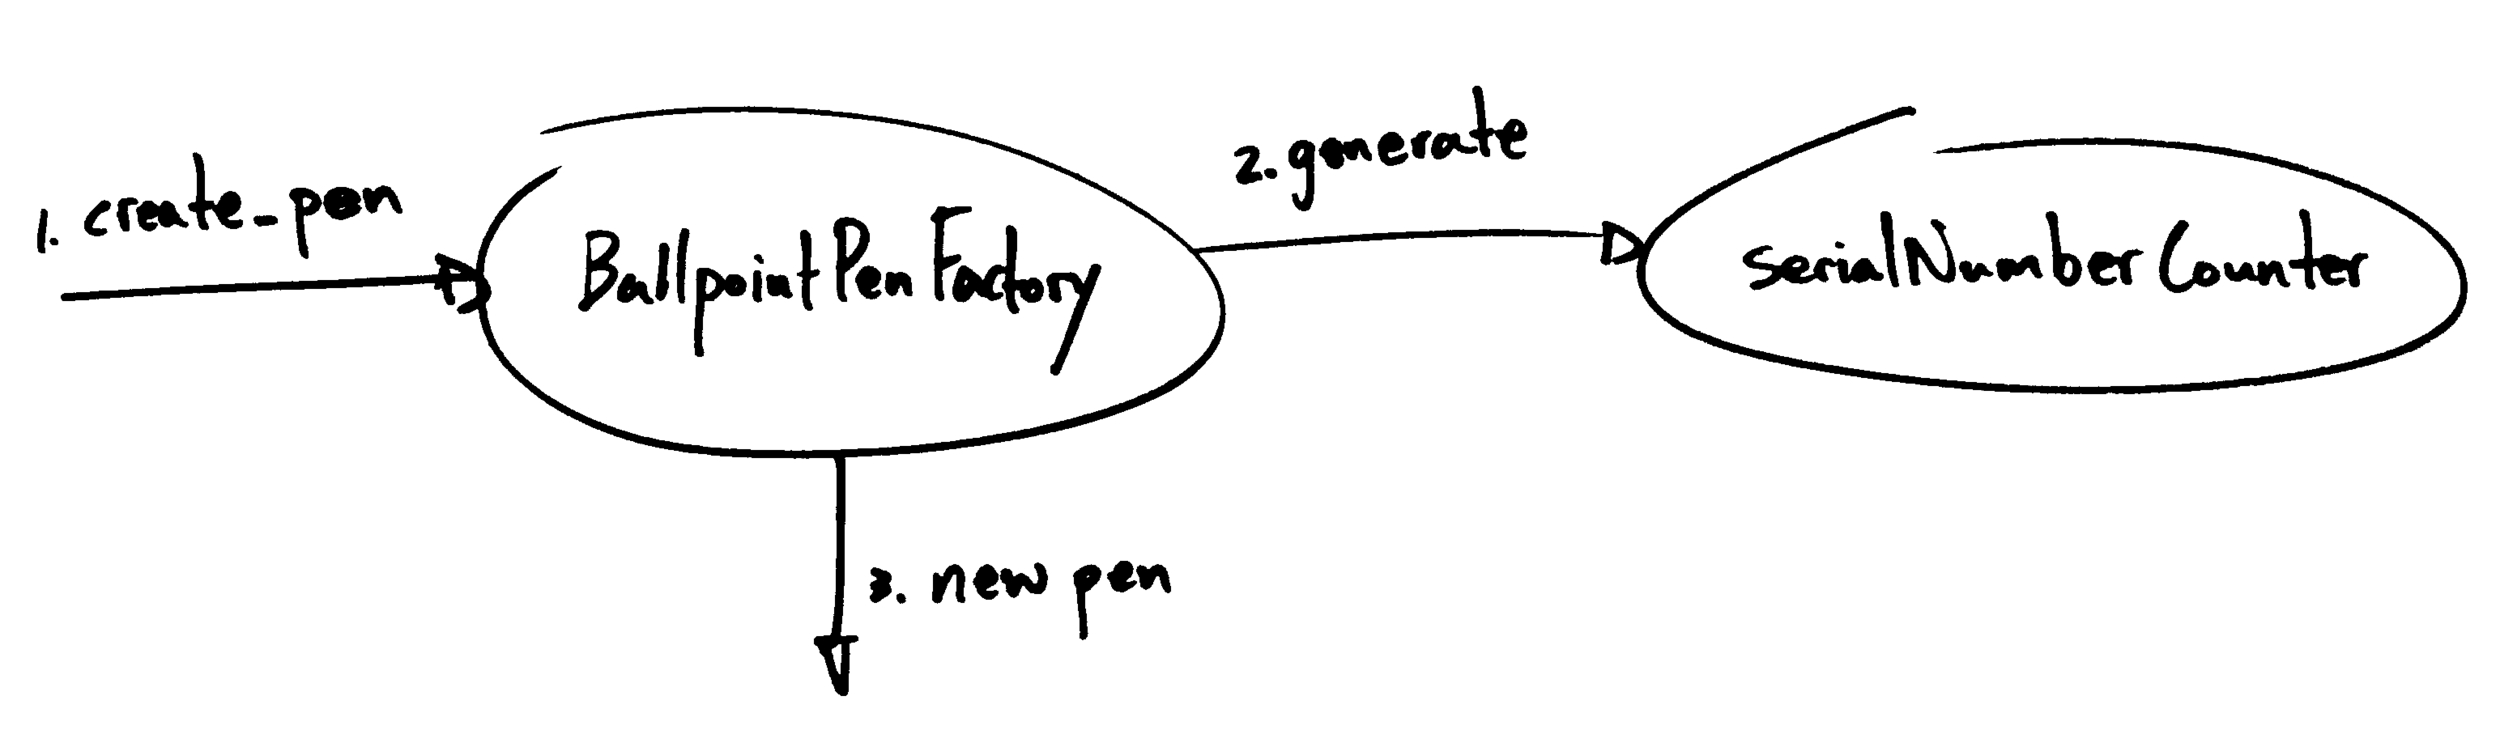
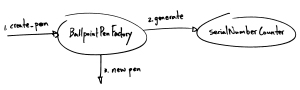
Sometimes wiring is not as straightforward as calling the appropriate factory method. The first factor that can complicate wireup is the need to maintain state across several invocations of a factory. In our pen example, what could we do if each pen needed a unique serial number? We might achieve this by maintaining a counter to generate successive serial numbers, passing each serial number as a parameter to the factory method.

However, this approach is cumbersome for the user, who shouldn’t have to care about the details of how the serial numbers are generated. Instead, these details should be hidden within the factory itself. Why not write a factory class that can maintain the counter state internally? The factory would store the counter as a member variable and increment it whenever it created a new pen. This process is transparent to the user of the factory class.

IMG_2614

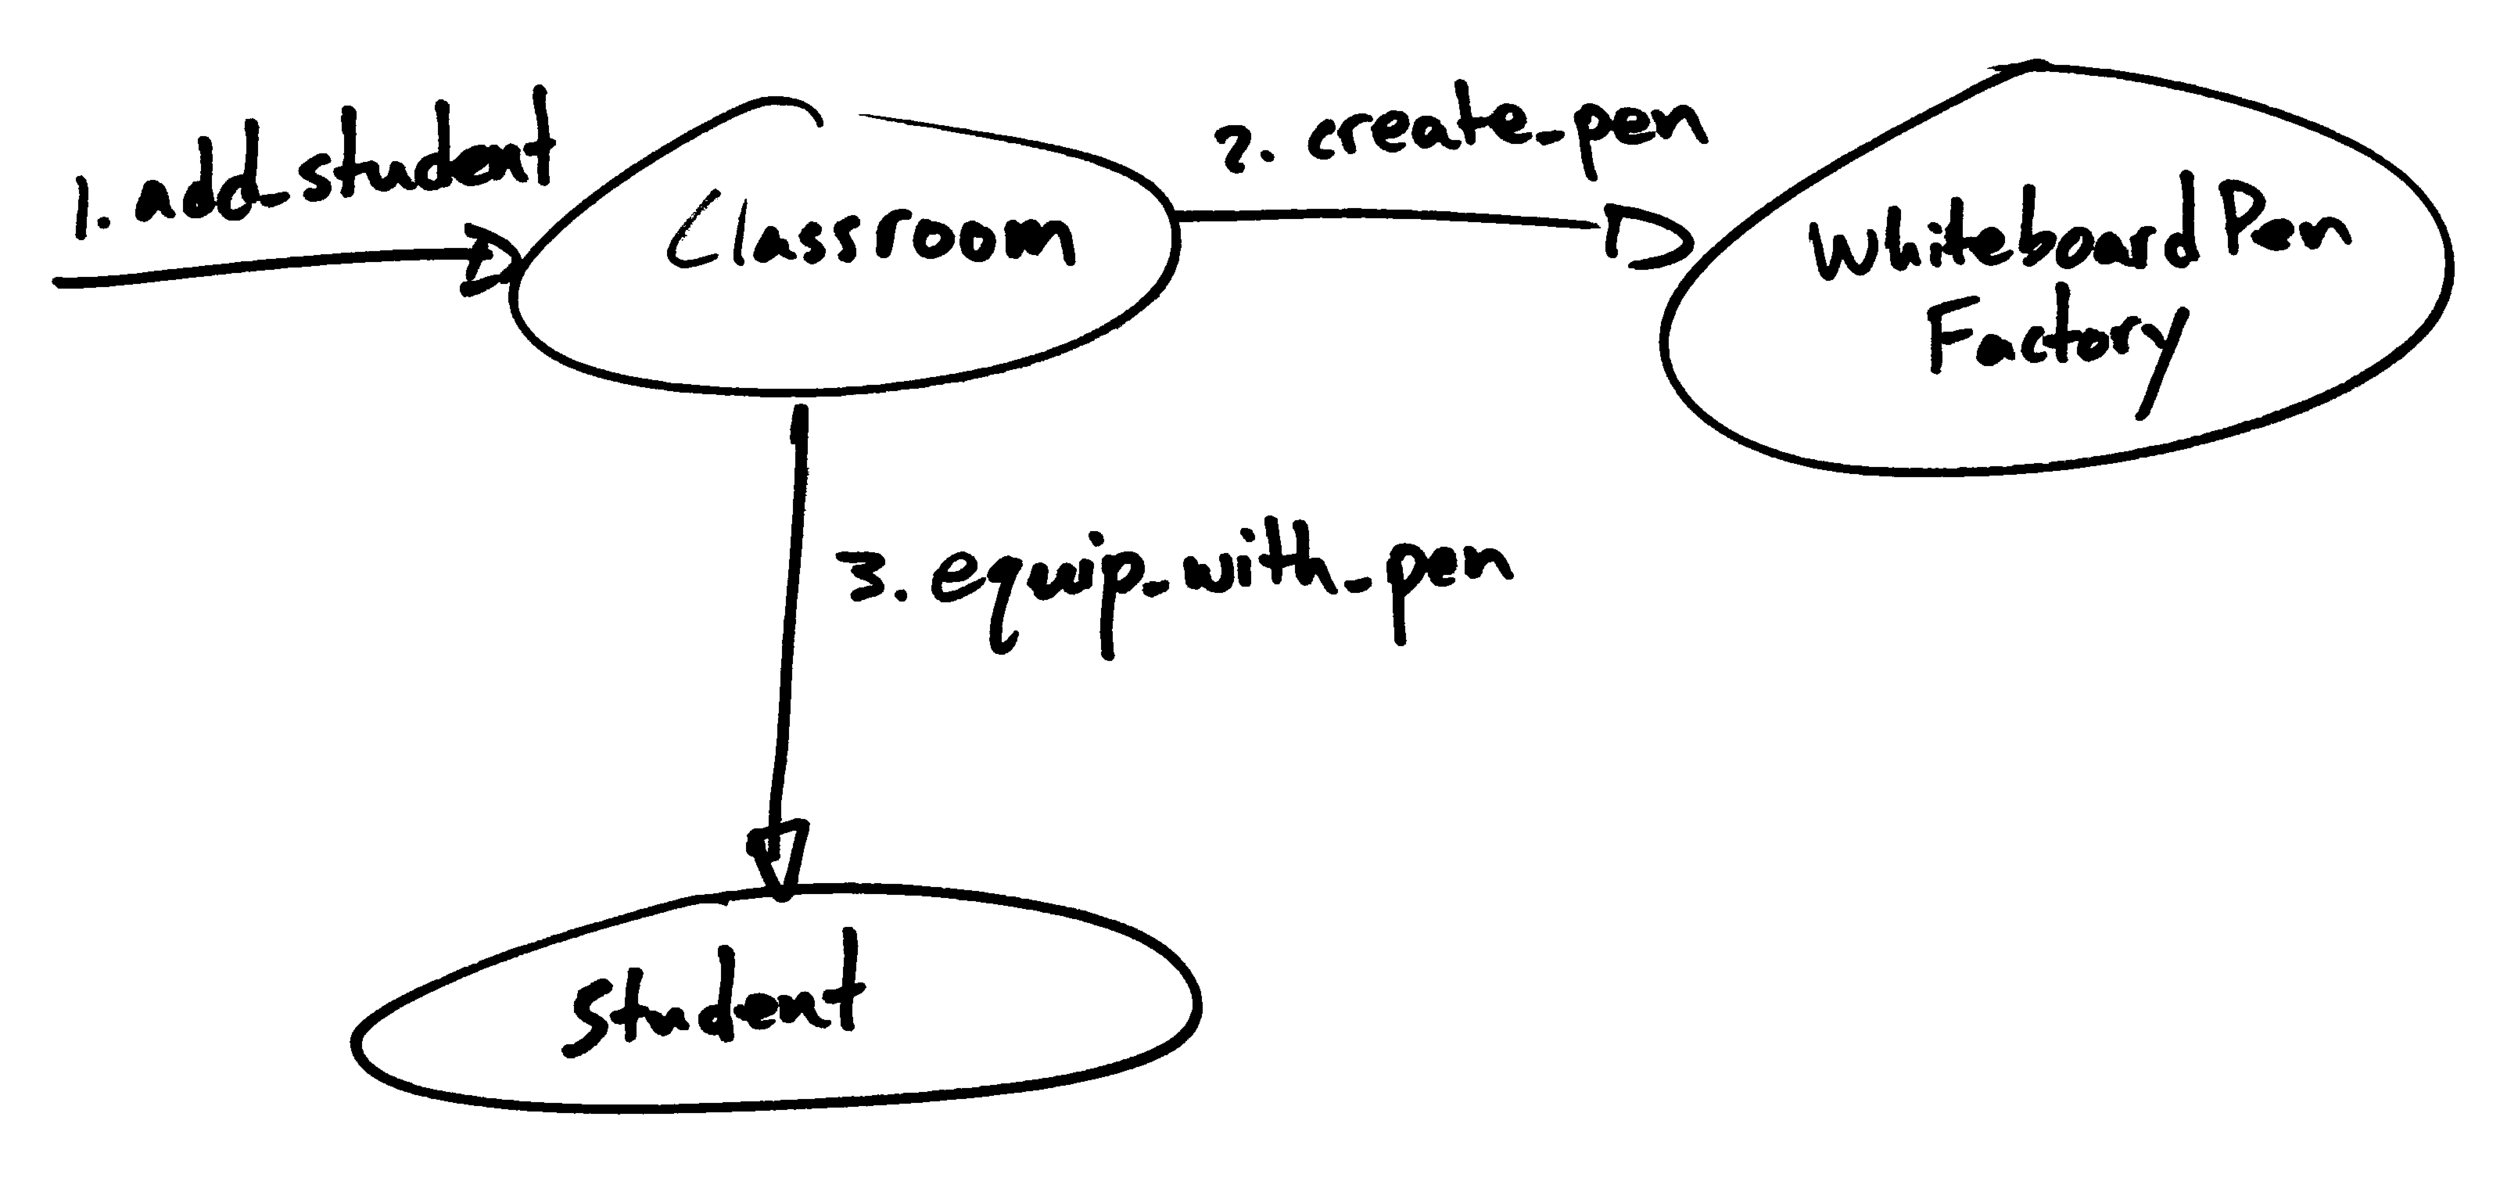
Another reason you might create a factory class is if you have a system that needs to create components but doesn’t care about the specific type of component created. Imagine we are modeling a school classroom. The classroom must provide one writing implement for every student who walks through the door.

When we create the classroom, we can inject a ballpoint pen factory into its initializer. The classroom calls create_pen() on the factory instance each time a student enters the classroom. Once again, this approach helps us keep our options open for future extension. For example, we might decide that students will write on whiteboards. In this case, we simply inject a whiteboard pen factory into the classroom. The classroom itself doesn’t need to change in order to support the new behavior.

IMG_2615

This approach is probably the most flexible of the wiring options we’ve discussed. It allows the developer to fully separate wiring code from domain code, maintain wiring state, and inject the wiring system into other components. On the other hand, this is also the heaviest approach. If you create a factory class for every class, then you wind up doubling the number of classes in your system. This places a great burden on someone else who is trying to make sense of your system. If you find yourself creating factory classes for your factory classes, you’ve definitely gone too far with this approach.

Sometimes you need the ability to maintain state and inject a factory, but creating a whole new class just feels overkill. In these cases, lambdas fit the bill quite well. They carry context along with them, they can be passed around just like any other object, and they can act as factories. But be forewarned, your lambda can get pretty unwieldy if you have a significant amount of wiring code. If your code starts getting hairy with large lambda definitions, you’re probably best served by extracting it into a class.

I’ve found that it works well to start with the class factory method and refactor to meet the demands of new requirements as the system evolves. Refactoring is generally not too difficult because you’ve already got your wiring code and your domain code separated. It’s usually just a matter of moving the wiring code around into the right location.

Concluding Thoughts

If you’ve done any reading about software engineering, you’ve likely come across the SOLID acronym which attempts to summarize some of the basic principles of software design. In my view, the stuff we’re discussing here is all about SOLID. For example, the separation of wiring and domain code is a direct application of the single responsibility principle. Our example of injecting a pen factory into a classroom is an application of the Liskov substitution principle (classrooms may use any sort of factory that produces a compatible pen), the dependency inversion principle (the pen factory is injected into the classroom), and the open-closed principle (the behavior of the classroom can be extended without modifying the class by injecting a different kind of factory).

I waited until the end of the article to mention these connections to SOLID because I believe that learning the principles from the top down can sometimes leave a person with only a vague sense of their value and how they might be practically applied. This article represents how I personally came to understand and internalize most of the principles of SOLID.

My aim in this article was to emphasize the need for separation between wiring and domain code and provide some simple tools for achieving this separation. In general, my software design approach can be summarized as follows:

  1. Model the domain draw diagrams showing how the components interact.
  2. Ask how the components get wired up in the first place and draw more diagrams.

When thinking about which wiring tool to reach for, I usually reach for the simplest one that will satisfy my current needs and plan on refactoring later when requirements change. I’ve found this approach to yield flexible designs that are able to cope well with changing requirements. As with anything, it’s possible to go overboard with this stuff, so if you feel like the code is working against you, it might be time to stop and re-evaluate. This topic is closely related to the topic of object composition. If you are interested in learning more about that, take a look at my previous post. Thanks for reading!

A Composition Regarding Inheritance

Observations from an Object Oriented Interview

I've had the opportunity to interview a number of candidates for software engineering positions on my team over the past few years. In most of these interviews, I presented the candidate with the same design question: “Let’s say you were designing a traffic simulation. In this simulation, you’ve got a car. It can start, stop, move forward, and move in reverse. Yes, it’s a really boring simulation.” I then asked the candidate to draw this design on a whiteboard. In every interview, I got something that looked like the following picture:

Ok, so far, so good. The candidate thinks of a car as a component in a software system that has capabilities matching my requirements. Then I said, “let’s make this simulation more interesting by including two cars: A and B. Car A and B are similar, but the way car A starts and stops is different from car B. Please update your diagram to show how you would accommodate this requirement while minimizing the amount of repeated code.” In almost every case (and especially when the candidate was fresh out of school) I got the same reaction: a confident smile appeared on the candidate’s face, as if to say, “I’ve done this a million times...textbook object oriented programming.” The candidate returned to the whiteboard and drew this:

composition-regarding-inheritance

“Okay, next task: I want to introduce a new car, say car C. Car C starts like car A, stops like car B, and has its own way of moving forward. Please update the diagram to accommodate this requirement while minimizing the amount of duplicated code.” Long pause. Eyebrows furrowed. At this point, the solutions people gave begin to diverge. C++ folks began struggling with multiple/virtual inheritance, Ruby folks started talking about mixins, and Java folks were stuck. Regardless of the language, the diagram ended up with some more lines to indicate inheritance relationships. I simply proceeded to ask the candidate to add new cars with different combinations of functionality. So for example, I asked the candidate to add car D which moves forward the same way as C, starts like car A, and stops like car B. I continued this process until the whiteboard diagram was an incomprehensible mass of circles and arrows.

My goal in this exercise was not to torture the candidate or to see if they “knew object oriented programming,” but to watch their thought process as they realized that their design approach was brittle and needed some rethinking. At some point the exasperated candidate stopped and said, “there must be a better way,” and this was generally the beginning of a fun and constructive design discussion.

The next question I asked in such interviews was, “can you think of a way to redraw this diagram without any inheritance or mixin relationships.” Many people really struggled with this -- they thought that I was asking a trick question. “Here’s a hint, what if you had a class called Ignition? How would you use it in this picture to remove some of these other class relationships.” This was usually the moment of epiphany for the candidate. The vocabulary of our discussion rapidly expanded from talking about the methods of the Car class to new concepts like Brake, Accelerator, and Transmission. Pretty soon our diagram looked like this:

composition-regarding-inheritance

Pretty straight forward. This design approach is called class composition. Many of the candidates said, “wow, that solution should have been obvious to me.” Maybe so, but I must admit that I had their very same approach to design when I first began working at a software company. To some, the software requirements described in the exercise may seem pathological, but this has not been my experience. I feel that the exercise is actually a pretty good picture of the way some of the first software projects that I worked on developed after I graduated. I encountered many of the same frustrations that the candidates I interviewed did, just on a larger scale.

Those who are familiar with Ruby will point out that mixins are another way to meet the requirements of the system described above. For example, we might create Startable, Stoppable, and Movable mixins that could be included in any combination within our different car classes. But, in the context of the interview exercise, I could still push my requirements further. “Okay, let’s say we want a new car X that starts like car A on hot summer days, but starts like car B on cold winter days. Please update your diagram to accommodate this requirement while minimizing the amount of repeated code.” This is trivial with a composition-based design. Our car X just updates its ignition reference from IgnitionA to IgnitionB on cold days. This is more difficult to achieve with Ruby mixins since, again, we declare an explicit class relationship before runtime. Or how about another requirement, “let’s say that the start sequence for car Y begins with the sequence for car A and ends with the sequence for car B.” Again, the mixin relationship represents a design commitment we make up-front that reduces our options later in the game. Traditional inheritance and mixins are very similar in this respect.

Comparing Composition and Inheritance as Design Tools

Why is it that many of us have a tendency to approach design problems using inheritance rather than composition? One reason could be the way object oriented programming is presented in school and in textbooks. Whenever I asked interview candidates why they chose inheritance over composition, the general response was that inheritance describes an is-a relationship and composition describes a has-a relationship. They initially felt that the interview exercise was best suited to an is-a relationship, so that’s what they went with. Indeed, this is exactly how I learned to think about object oriented programming. The problem with this view is that the classification is subjective. You can almost always think of a way to convert an is-a relationship into a has-a relationship and vice-versa, just like I described in my example above.

The is-a/has-a paradigm can give one the impression that composition and inheritance are two similar tools on equal footing that can be used interchangeably to achieve a similar goal. In reality, these tools have very different strengths and are therefore suited to different problems. It is wise, then, to consider these strengths in choosing which tool to apply in a particular situation.

I've already alluded to some of composition’s strengths in the examples above. These include a greater opportunity to defer design commitments and a more natural way to talk about and model the problem space. The first is due to the fact that composed relationships are based on object references, not class references. In the car example above, we refactored our design such that a car is composed of several internal components. In this scheme we have the option of changing the references to these components at any time, including runtime. That is to say, we could design a system in which a car could be reassembled with totally different components all while traveling 80 mph down the highway. That’s pretty powerful. With inheritance, we would either need to stop our software and modify the inheritance hierarchy or, if we were working in Ruby, engage in some metaprogramming wizardry. The point is, with composition we minimize early design commitments and maximize the likelihood we'll be able to accommodate unexpected requirements.

The other strength is somewhat less tangible in a discussion like this, but in my view no less important. Composition is the way we generally think about how systems work in the physical world. It therefore lends itself nicely to the development of clear vocabulary for talking about a problem. If I asked you to tell me how a blender works, you would probably begin by identifying the key components: blade, motor, power cord, switch, carafe, and lid. Each component in the system has a specific job and works in concert with other components in the system. For a given blender use-case, you could draw me a diagram of how the parts interact with one another -- the motor turns the blade, the lid locks into the carafe, the switch opens the flow of electricity through the motor. On the other hand, you could consider an inheritance-based approach. You might begin by describing a blender as a type of kitchen appliance. Appliances consume electricity to perform work, where the work performed depends on the specific type of appliance. In the case of a blender, the work performed is the rotation of a blade to chop or liquify food. While this is a reasonable definition for a blender, it tells us little about what a blender is from an implementation point of view. Based on this description, it would be more difficult to draw a diagram of what happens internally when someone presses the “on” switch.

Our blender discussion brings us back around to the is-a/has-a distinction, but perhaps with the opportunity for a deeper understanding. The composition-based design is better suited for describing how our blender accomplishes its job whereas the inheritance-based design is better suited for defining what a blender is. Do you see the difference? The definition of a blender can apply to a wide range of blender implementations. Silver Bullet and VitaMix are both blenders but they have different implementations. Our view of a blender as the composition of many parts represents the description of a specific blender implementation. Inheritance therefore finds it’s strength in describing the relationships between class interfaces apart from implementation. Composition by its very nature is an implementation detail and finds it’s strength in modeling the implementation of a system. This observation has major implications for software design in explicitly typed languages like C++ and Java. In these languages, we can define a hierarchy of pure interfaces (that is, classes with method definitions but no corresponding implementation). We can then refer to objects at different levels of abstraction in various contexts by moving up or down the interface inheritance chain. The classes which implement these interfaces, however, can follow a different structure and can be changed without modification to the interfaces.

I won't get into a detailed discussion of interface-based design here -- it’s a topic that deserves it’s own discussion. I expect that most of the people reading this article are Rubyists. Ruby does not provide an explicit interface concept so the benefits of inheritance for interface-based design are diminished. In the Ruby realm I most often see inheritance applied as a method of code reuse. While code reuse is certainly achievable with inheritance, I hope our discussion so far has provided some convincing evidence that this is not what it excels at -- just consider the frustrated interview candidate from the beginning of this article. Composition for code reuse is more flexible than inheritance and typically comes at little cost.

Okay, so what are the strengths of inheritance in a language like Ruby? I view inheritance in Ruby as a tool of convenience; one that can reduce boilerplate code in cases where several classes share the same method signatures. Consider again the traffic simulation design in my interview question. Each type of car in this example delegates its methods directly to the internal components. This leaves us with a bunch of classes that repeat the same delegation pattern in each method, just with different types of components. This boilerplate code can be removed with the creation of a base class which operates on components provided by subclasses. Notice that we’ve used composition and inheritance together to achieve a flexible and convenient design.

composition-regarding-inheritance (2)

That said, I think there is an even better approach that does not use inheritance if our design does not require a separate class for each type of car. In this case, we can implement a single car class and a car factory that builds cars. The car factory creates different configurations of components depending on what behavior we want in our car and injects them during creation of the car object. See the figure below:

composition-regarding-inheritance (3)

What about the role of mixins in Ruby? Again, in my view mixins provide a measure of convenience, but do not represent a tool that is well suited as the foundation of a system’s design. The Enumerable mixin is a good example to consider. The Enumerable module in Ruby requires that classes which include it implement the each method (and optionally the <=> method). It uses these methods to provide a rich set of traversal, sorting, and searching methods in the including class. Ruby mixes the Enumerable methods into several basic data types including arrays, hashes, and ranges. Working with these types is quite pleasant since they allow all of these methods to be called directly on the objects themselves and allow for several method calls to be chained together. Most people would probably see the Enumerable module as a great example of code-reuse, but I disagree. The same degree of code-reuse can be achieved through simple class methods within a module. Here’s what the call to any? would look like if Enumerable were written in this way:

Enumerable::any?(numbers) { |number| number > 10 }

The main benefit of the mixin approach is ease-of-use. It is more natural for a developer to call the methods directly on the objects, especially when several method calls need to be chained together. Calling class methods in a module is still doable, but would be quite cumbersome in such cases. So the advantages we see in the Enumerable mixin example focus on syntactic niceties. They help developers read and write code (and this is certainly important!), but they do not significantly contribute to a developer’s conceptual understanding of a system, which I believe should be considered as a first priority when designing software.

Concluding Thoughts

The longer I work with object oriented programming languages, the more clearly I see a priority in tools these languages have to offer. In my opinion, composition is the bread and butter of design tools. It’s the tool I reach for first when I’m trying to model the solution for a problem. Doing this allows me to develop meaningful vocabulary for talking about each aspect of the solution. I find that I can draw diagrams showing clear interactions between components and this allows me to verify my understanding of the solution before I spend time implementing it. Once I have implemented my solution using composition, I sometimes notice repeated or excessive boilerplate code. In such cases, I will turn to my tools of convenience: inheritance and modules (domain specific languages and metaprogramming also fall into this category for me). These tools are the icing on the cake. The system can be understood without them, but they can make using or extending the system more pleasant.

When I first learned about object oriented programming I read a book that made this recommendation: “prefer composition; use inheritance judiciously.” This bit of wisdom stood out to me mainly because I didn’t really understand why I should follow it. I’m sure the book provided some justification regarding flexibility, but not in a way that I could grasp at the time. It was only after several years of pain from ignoring this advice that I began to see the basis for it. My hope in writing this article is that others would be provoked to careful thought regarding the application of inheritance in object oriented languages and perhaps avoid some of the same frustration I encountered. Thanks for reading!

My Experience With Mob Programming

At Appfolio we often have guest speakers from the software community come in and present topics at our internal tech talks. Three months ago we had guest speaker Woody Zuill here to describe a practice he and his team use called Mob Programming.

We already encourage our developers to pair program due to the numerous advantages we find that it provides. These advantages include having two sets of eyes on a problem and having mentorship between more and less senior developers. Mob programming takes the idea of pair programming to its extreme. The basic concept is to have everyone on the team take part in a collaborative coding session, with one person as the driver and everyone else as navigators.

When Woody began talking to us, he showed us a time-lapse video of his team during their typical work day, with large text over the screen pitching the concept of mob programming. The letters at one point read “Using this technique the team has achieved 10x productivity”. Needless to say, I was a bit skeptical. The rest of the presentation dove into the details of how Woody and his team use mob programming, but the basic concept was easy to understand. The question is, can having your entire team (usually 5-7 people in Woody’s video) focused on the same task using the same screen, keyboard, mouse, and editor actually be better than more traditional methods?

After the talk, my team discussed what we liked and disliked about the idea of mob programming. Since at Appfolio teams can adopt and practice new techniques without any sort of approval, we decided that we’d give mob programming a shot. If it worked then we’d have a valuable new tool. If not then no real harm done besides possibly being a few commits behind. With that in mind, we hijacked a conference room and got to work.

The first feature we tried the new technique out on was very UI heavy. Having the whole team (three developers and one QA engineer) present helped out not only in visual design decisions, but also in remembering which CSS styles to use where. Not to mention, asking product managers or UX specialists to come join the mob for questions and group conversation was very easy.

We finished the feature in considerably less time than we thought it would take, yet still had a very high quality, well tested piece of software. Having other developers around kept us accountable for having good test coverage, using good design patterns, and refactoring any nasty code we’re currently touching.

We’ve since worked on many other features using the technique and found our experience to, for the most part, be more of the same. Recently, it has been especially useful having so many eyes to look at some of the more critical changes we have been working on, such as enhancements to the payments platform. Despite our success, it doesn’t mean that there aren’t downsides or that mob programming works for everyone.

How can we evaluate whether or not a software development technique is better than any other? As far as I can tell, there are at least four things we can try to measure.

1) How productive is the team? (i.e. how much gets done per unit of time)

2) How high quality is the product? (not only customer facing quality but also code quality)

3) How much are team members learning? (do less experienced team members get mentoring)

4) How happy are the individuals on the team? (do you go home happier at the end of the day)

Unsurprisingly, the team did not achieve 10x productivity. In fact, we found our productivity to be almost the same as it was before. We’re not sure how Woody’s team measured their productivity increase, or what their workflow looked like before, but it seems that our findings were not the same here. Is it worth mob programming solely based on productivity boosts? Your mileage may vary, but as far as we’re concerned it’s a resounding no.

Is the product higher quality? Is there better test coverage? Is the code idiomatic and does it follow best practices? Are the chances of a bug crawling into the product minimized? From our experience this is the most emphatic yes of all the concerns listed above. Not only does having everyone together increase accountability and awareness, but mistakes that may be made by more junior developers are more likely to be caught. Furthermore, when our QA engineer was in the mob, he gained a much better sense of how to go about testing the feature as thoroughly as possible.

How much learning is going on? This question doesn’t really have a straightforward answer. Yes, more senior developers get to spread expertise to the less senior ones, and that is enormously useful, but that’s not all that is involved in learning. Personally, I know that sometimes I just need some time to myself to dive into unfamiliar code and figure out what is going on. When the mob is working, people not at the keyboard can’t pause time and open a rails console to experiment, and they can’t go down the rabbit hole of some large stack of functions to find out what’s really going on. And while those at the keyboard may physically be able to do so, they probably shouldn’t if they want the other team members to stay engaged.

Do we go home happier at the end of the day? It’s hard to tell really. I do enjoy getting to interact with all of my team members all day, but it’s honestly a little draining sometimes. Being a fairly introverted person myself, the constant interaction is more of an energy drain than a lot of my previous work at the company, despite possibly being more fun. By the end of the work day I often find myself anxious to get home and recharge with a good book or a show on Netflix.

What other pitfalls might exist? For one, we’ve found that having three developers seems to be the magic number, at least for us. Any more and we’d experience a decrease in productivity without an equally valuable increase in quality, learning, or happiness. Most of our teams have four developers, so this might explain why we are the only team that I am aware of who has tried mob programming and stuck with it. On that note, is it still a mob with only three developers? (Lately our QA engineer seems to get caught up in other work much of the time, despite spending a lot of time in the mob initially) In addition, keeping everyone engaged is important. If one or two people dominate the conversation, it’s pretty easy for others to completely lose focus or get bored. If you find yourself losing focus often, try to be the driver more.

If you do decide to try mob programming, here are a few suggestions that we found work for us:

1) Keep track of time. We have timer cubes that allow whoever is at the keyboard to pick how long they want to drive. Once the timer goes off, switch to a new person.

2) Get a big screen. We started out using large television screens in conference rooms and after getting kicked out of enough rooms we decided to just swipe a nice 50 inch LED screen and put it in our team’s normal work area.

3) Try to merge everyones’ preferred bash/git aliases together to minimize “command not found” errors at the terminal. On the same note, try to have everyones’ editor of choice available. We have two VIM users and one RubyMine user on the team, but we’re all comfortable with both after working together.

So that’s about it. We plan on sticking with mob programming on our team for the short term. However, none of the other teams are still using it. Will we keep using it? Who knows. Yes for the short term, but probably not forever, especially considering how often we rotate teams to spread knowledge. Should you use mob programming? It’s hard to say for sure, but I definitely recommend giving it a try.

Ruby Mixins & ActiveSupport::Concern

A few people have asked: what is the dealio with ActiveSupport::Concern? My answer: it encapsulates a few common patterns for building modules intended for mixins. Before understanding why ActiveSupport::Concern is useful, we first need to understand Ruby mixins.

Here we go...!

First, the Ruby object model:

http://blog.jcoglan.com/2013/05/08/how-ruby-method-dispatch-works/ http://www.ruby-doc.org/core-1.9.3/Class.html

As you can see mixins are "virtual classes" that have been injected in a class's or module's ancestor chain. That is, this:

module MyMod
end

class Base
end

class Child < Base
  include MyMod
end

# irb> Child.ancestors
#  => [Child, MyMod, Base, Object, Kernel, BasicObject]

results in the same ancestor chain as this:

class Base
end

class MyMod < Base
end

class Child < MyMod
end

# irb> Child.ancestors
#  => [Child, MyMod, Base, Object, Kernel, BasicObject]

Great? Great.

Modules can also be used to extend objects, for example:

my_obj = Object.new
my_obj.extend MyMod

# irb> my_obj.singleton_class.ancestors
#  => [MyMod, Object, Kernel, BasicObject]

In Ruby, every object has a singleton class. Object#extend does what Module#include does but on an object's singleton class. That is, the following is equivalent to the above:

my_obj = Object.new
my_obj.singleton_class.class_eval do
  include MyMod
end

# irb> my_obj.singleton_class.ancestors
#  => [MyMod, Object, Kernel, BasicObject]

This is how "static" or "class" methods work in Ruby. Actually, there's no such thing as static/class methods in Ruby. Rather, there are methods on a class's singleton class. For example, w.r.t. the ancestors chain, the following are equivalent:

class MyClass
  extend MyMod
end

# irb> MyClass.singleton_class.ancestors
#  => [MyMod, Class, Module, Object, Kernel, BasicObject]

class MyClass
  class << self
    include MyMod
  end
end

# irb> MyClass.singleton_class.ancestors
#  => [MyMod, Class, Module, Object, Kernel, BasicObject]

Classes are just objects "acting" as "classes".

Back to mixins...

Ruby provides some hooks for modules when they are being mixed into classes/modules: http://www.ruby-doc.org/core-1.9.3/Module.html#method-i-included http://www.ruby-doc.org/core-1.9.3/Module.html#method-i-extended

For example:

module MyMod
  def self.included(target)
    puts "included into #{target}"
  end

  def self.extended(target)
    puts "extended into #{target}"
  end
end

class MyClass
  include MyMod
end
# irb>
# included into MyClass

class MyClass2
  extend MyMod
end
# irb>
# extended into MyClass2

# irb> MyClass.ancestors
# => [MyClass, MyMod, Object, Kernel, BasicObject]
# irb> MyClass.singleton_class.ancestors
# => [Class, Module, Object, Kernel, BasicObject]

# irb> MyClass2.ancestors
# => [MyClass2, Object, Kernel, BasicObject]
# irb> MyClass2.singleton_class.ancestors
# => [MyMod, Class, Module, Object, Kernel, BasicObject]

Great? Great.

Back to ActiveSupport::Concern...

Over time it became a common pattern in the Ruby worldz to create modules intended for use as mixins like this:

module MyMod
  def self.included(target)
    target.send(:include, InstanceMethods)
    target.extend ClassMethods
    target.class_eval do
      a_class_method
    end
  end

  module InstanceMethods
    def an_instance_method
    end
  end

  module ClassMethods
    def a_class_method
      puts "a_class_method called"
    end
  end
end

class MyClass
  include MyMod
# irb> end
# a_class_method called
end

# irb> MyClass.ancestors
#  => [MyClass, MyMod::InstanceMethods, MyMod, Object, Kernel, BasicObject]
# irb> MyClass.singleton_class.ancestors
#  => [MyMod::ClassMethods, Class, Module, Object, Kernel, BasicObject]

As you can see, this single module is adding instance methods, "class" methods, and acting directly on the target class (calling a_class_method() in this case).

ActiveSupport::Concern encapsulates this pattern. Here's the same module rewritten to use ActiveSupport::Concern:

module MyMod
  extend ActiveSupport::Concern

  included do
    a_class_method
  end

  def an_instance_method
  end

  module ClassMethods
    def a_class_method
      puts "a_class_method called"
    end
  end
end

You'll notice the nested InstanceMethods is removed and an_instance_method() is defined directly on the module. This is because this is standard Ruby; given the ancestors of MyClass ([MyClass, MyMod::InstanceMethods, MyMod, Object, Kernel]) there's no need for a MyMod::InstanceMethods since methods on MyMod are already in the chain.

So far ActiveSupport::Concern has taken away some of the boilerplate code used in the pattern: no need to define an included hook, no need to extend the target class with ClassMethods, no need to class_eval on the target class.

The last thing that ActiveSupport::Concern does is what I call lazy evaluation. What's that?

Back to Ruby mixins...

Consider:

module MyModA
end

module MyModB
  include MyModA
end

class MyClass
  include MyModB
end

# irb> MyClass.ancestors
#  => [MyClass, MyModB, MyModA, Object, Kernel, BasicObject]

Let's say MyModA wanted to do something special when included into the target class, say:

module MyModA
  def self.included(target)
    target.class_eval do
      has_many :squirrels
    end
  end
end

When MyModA is included in MyModB, the code in the included() hook will run, and if has_many() is not defined on MyModB things will break:

irb :050 > module MyModB
irb :051?>   include MyModA
irb :052?> end
NoMethodError: undefined method `has_many' for MyModB:Module
 from (irb):46:in `included'
 from (irb):45:in `class_eval'
 from (irb):45:in `included'
 from (irb):51:in `include'

ActiveSupport::Concern skirts around this issue by delaying all the included hooks from running until a module is included into a non-ActiveSupport::Concern. Redefining the above using ActiveSupport::Concern:

module MyModA
  extend ActiveSupport::Concern

  included do
    has_many :squirrels
  end
end

module MyModB
  extend ActiveSupport::Concern
  include MyModA
end

class MyClass
  def self.has_many(*args)
    puts "has_many(#{args.inspect}) called"
  end

  include MyModB
# irb>
# has_many([:squirrels]) called
end

# irb> MyClass.ancestors
#  => [MyClass, MyModB, MyModA, Object, Kernel, BasicObject]
# irb> MyClass.singleton_class.ancestors
#  => [Class, Module, Object, Kernel, BasicObject]

Great? Great.

But why is ActiveSupport::Concern called "Concern"? The name Concern comes from AOP (http://en.wikipedia.org/wiki/Aspect-oriented_programming). Concerns in AOP encapsulate a "cohesive area of functionality". Mixins act as Concerns when they provide cohesive chunks of functionality to the target class. Turns out using mixins in this fashion is a very common practice.

ActiveSupport::Concern provides the mechanics to encapsulate a cohesive chunk of functionality into a mixin that can extend the behavior of the target class by annotating the class' ancestor chain, annotating the class' singleton class' ancestor chain, and directly manipulating the target class through the included() hook.

So....

Is every mixin a Concern? No. Is every ActiveSupport::Concern a Concern? No.

While I've used ActiveSupport::Concern to build actual Concerns, I've also used it to avoid writing out the boilerplate code mentioned above. If I just need to share some instance methods and nothing else, then I'll use a bare module.

Modules, mixins and ActiveSupport::Concern are just tools in your toolbox to accomplish the task at hand. It's up to you to know how the tools work and when to use them.

I hope that helps somebody.

Discovery of a MySQL bug

Recently, one of our MySQL instances crashed. We responded to the alert, but by the time we logged into the server, the MySQL instance has already restarted and recovered. So, we started to investigate the cause of the crash. Our MySQL data volume is nfs-mounted on a NetApp filer in order to allow for reliable crash-recovery and data replication. Our monitoring system showed a spike of near-Gb-line-rate output from the MySQL server to the NetApp filer and it quickly became apparent that MySQL crashed because it ran out of disk space. However, the MySQL disk usage did not change. Instead, the space was used by the NetApp snapshots, each on the order of 20GBs. Snapshots, much like source control, keep track of changes made to files allowing you to view past versions. The NetApp is configured to automatically create snapshots and garbage collect old ones. However, as the rate of change grows, the size of snapshots grows as well. The writing of GBs of data caused enormous snapshots to be created. This meant that whatever wrote those massive files in a short time, also deleted them in that same short time.

Additional metrics in our monitoring system pointed us towards MySQL's internal temporary tables. MySQL uses these internal temporary tables to satisfy certain queries. When an internal temporary table becomes too big for memory, MySQL flushes it to disk. Once the query finishes, the internal temporary table is deleted. So, in this case, MySQL was processing a query and needed a 20GB internal temporary table!? Naturally, we need to find out what query is causing this and on which data set (each customer is stored in a separate database using the multi-tenancy principle).

Based on mytop and the MySQL slow query log, we were able to single out one suspicious query. It was a query executed by Solr's data import handler during delta reindex. The application knows which models and which attributes are stored in Solr. Whenever any of those models and attributes change, the application sends a request to Solr asking it to delta reindex. We have an extension in Solr which waits 60 seconds before actually delta reindexing, which effectively coalesces multiple delta reindex requests into a single delta reindex and lightening the load on the MySQL

It turned out that this suspicious query was changed at the beginning of December, but, due to the Christmas / New Year, was only in production for a couple of weeks. The change was rather unusual as it added a join from table A to table X to table B to a query that was already joining from table A to table Y to table B. This was a deliberate change allowing us to migrate from table X to table Y over a few development cycles and the fact that we now have a double join (and a cartesian product) from table A to table B was discussed at development time and was deemed okay. We assumed less than 50 rows resulting from the join of table A to table B, and so in the worse case we'd end up with 2,500 (50 x 50) rows because of the double join.

We found the internal temporary table that MySQL flushed to disk in one of the NetApp's snapshots. We then matched the data in that file to a particular data set. In this data set, the join from table A to table B had 500 rows, which would produce 250,000 (500 x 500) rows because of the double join. Clearly 250,000 rows is significantly larger than the expected 2,500 rows, but still nothing that MySQL should not be able to handle.

We manually explained and executed this query and we saw no issues whatsoever. Hmmm??? Perhaps this query was not the cause after all?

Nevertheless, we proceeded to copy the data set to our staging servers and see whether we can reproduce the issue there. Based on the suspicious delta reindex query, we knew what to edit in the UI in order to trigger that query. We made the edit and waited. The application asked Solr to delta reindex. Solr waited 60 seconds and started to delta reindex. After few seconds, Solr started to execute our suspicious query and after another 30 seconds, MySQL dumped 20GB internal temporary table to disk. Bingo!

So again we tried to manually explain and execute that query and again we saw no issues whatsoever. Wat!?

We speculated there must be some difference between Solr running the query and us running the query manually. We enabled the MySQL full query log and repeated the edit in the UI. This is what Solr executed,

711723 Query /* mysql-connector-java-5.1.21 ( Revision: ${bzr.revision-id} ) */SELECT @@session.auto_increment_increment
711723 Query SHOW COLLATION
711723 Query SET NAMES utf8mb4
711723 Query SET character_set_results = NULL
711723 Query SET autocommit=1
711723 Query SET sql_mode='STRICT_TRANS_TABLES'
711723 Query SET autocommit=0
711723 Query <delta reindex query>

We quickly focused on SET NAMES utf8mb4. Running the delta reindex query from MySQL client by itself did not cause the problem, but running the delta reindex query after SET NAMES utf8mb4 caused the 20GB file. In fact, we tried other encodings, including utf8, and all of them seem to cause the 20GB file. The only one that worked seemed to be latin1.

This led us to realize that by default our MySQL client uses latin1 whereas our application and Solr use utf8 and utf8mb4, respectively. So in theory, if Solr used latin1 encoding it would avoid the 20GB file. We quickly reconfigured Solr to use latin1 and sure enough, it worked.

Our attention now turned to understanding why that particular delta reindex query on that particular data set with utf8mb4 encoding was causing MySQL to write 20GB file. It turns out MySQL has a bug when a GROUP_CONCAT(DISTINCT ...) is too big to fit in memory and requires MySQL to flush to disk. In our case, the bug is triggered because utf8 / utf8mb4 use multiple bytes per character where as latin1 uses one byte per character. You can read more details about this bug here.

Don't make your users wait for GC

One of the weaknesses of Ruby is garbage collection. Although some improvements have been made (tunable GC settings, lazy sweep, bitmap marking), it is still a simple stop-the-world GC. This can be problematic especially for large applications. We have a rather large application running on Passenger 3 using REE 1.8.7 with tuned GC. As the application grew, the GC performance has been degrading until we were faced with the following situation where GC averages 130 ms per request.

It was time to address our obvious GC problem.

We could have continued to tune the GC and optimize memory usage to reduce the impact of GC on response times. But why? Why have the GC impact the response time at all? Instead, we decided to trigger GC after one request finishes but before the next request starts. This is not a new idea. It is actually generically referred to as out of band work (OOBW). It has been implemented by Unicorn and discussed here. However, it is not supported by Passenger. So we decided to add OOBW support to Passenger.

Our patch allows the application to respond with an additional header, namely X-Passenger-OOB-Work. When Passenger sees this header, it will stop sending new requests to that application process and tell that application process to perform the out of band work. The application registers oob_work callback for the work it wants done using Passenger's event mechanism. When the work is done, the application process resumes handling of normal requests.

All the application code can be packaged in an initializer,

PhusionPassenger.on_event(:oob_work) do
 t0 = Time.now
 GC.start
 Rails.logger.info "Out-Of-Bound GC finished in #{Time.now - t0} sec"
end

class RequestOOBWork
 def initialize(app, frequency)
   @app = app
   @frequency = frequency
   @request_count = 0
 end

 def call(env)
   @request_count += 1
   status, headers, body = @app.call(env)
   if @request_count % @frequency == 0
     headers['X-Passenger-Request-OOB-Work'] = 'true'
   end
   [status, headers, body]
 end
end

Rails.application.config.middleware.use RequestOOBWork, 5

After experimentation, we decided to trigger GC after every 5 requests. If you set the parameter too high, then GC will continue to occur in the middle of requests. If you set the parameter too low, then application processes will be busy performing their out-of-band GC causing Passenger to spawn more workers.

With these changes in place, our graphs show 10x improvement in GC average per request,

The patch we implemented and deployed to production is for Passenger 3. It is available here.

Passenger 4 is currently under active development. In fact, beta 1 has already been released. We've ported our patch to Passenger 4. It is merged and expected to be included in beta 2.